
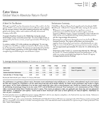
Overview
|
|
|||||||
| Annualized | |||||||
| 1 Mo. | 3 Mos. | YTD | 1 Yr. | 3 Yrs. | 5 Yrs. | 10 Yrs. | |
| Fund at NAV | 3.10 | 2.09 | 2.09 | 2.29 | -9.21 | 1.09 | 3.73 |
| MSCI Emerging Markets Index1 | 2.48 | 2.37 | 2.37 | 8.15 | -5.05 | 2.22 | 2.94 |
| Past performance is no guarantee of future results. Investment return and principal value will fluctuate so that shares, when redeemed, may be worth more or less than their original cost. Performance is for the stated time period only; due to market volatility, the Fund’s current performance may be lower or higher than quoted. Returns are historical and are calculated by determining the percentage change in net asset value (NAV) with all distributions reinvested. Returns for other classes of shares offered by the Fund are different. Performance less than or equal to one year is cumulative. Performance prior to December 31, 2016 reflects the performance of the Fund’s former adviser, Calvert Investment Management, Inc. The share class has no sales charge. | |||||||
| Class I Inception | 10/29/2012 |
| Investment Objective | Long-term capital appreciation |
| Total Net Assets | $1.7B |
| Minimum Investment | $1000000 |
| Expense Ratio (Gross)2 | 1.03% |
| Expense Ratio (Net)2,3 | 0.99% |
| CUSIP | 131649774 |
| Taiwan Semiconductor Manufacturing Co Ltd | 9.60 |
| Samsung Electronics Co Ltd | 7.93 |
| Tencent Holdings Ltd | 4.49 |
| Prosus NV | 3.12 |
| Bank Rakyat Indonesia Persero Tbk PT | 3.05 |
| Infosys Ltd | 2.90 |
| ICICI Bank Ltd | 2.85 |
| NARI Technology Co Ltd | 2.63 |
| Itausa SA | 2.51 |
| Richter Gedeon Nyrt | 2.50 |
| Total | 41.59 |
| Kunjal Gala | Managed Fund since 2019 | ||
| Vivek Bhutoria, CFA | Managed Fund since 2022 | ||
| Christopher Clube | Managed Fund since 2022 |
Portfolio profile subject to change due to active management. Percentages may not total 100% due to rounding.
RISK CONSIDERATIONS
The value of investments held by the Fund may increase or decrease in response to economic, and financial events (whether real, expected or perceived) in the U.S. and global markets. The value of equity securities is sensitive to stock market volatility. Investments in foreign instruments or currencies can involve greater risk and volatility than U.S. investments because of adverse market, economic, political, regulatory, geopolitical, currency exchange rates or other conditions. In emerging countries, these risks may be more significant. Investing primarily in responsible investments carries the risk that, under certain market conditions, the Fund may underperform funds that do not utilize a responsible investment strategy. The Fund is exposed to liquidity risk when trading volume, lack of a market maker or trading partner, large position size, market conditions, or legal restrictions impair its ability to sell particular investments or to sell them at advantageous market prices. The impact of the coronavirus on global markets could last for an extended period and could adversely affect the Fund’s performance. No fund is a complete investment program and you may lose money investing in a fund. The Fund may engage in other investment practices that may involve additional risks and you should review the Fund prospectus for a complete description.
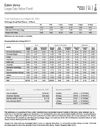
Performance
|
|
|||||||
| Annualized | |||||||
| 1 Mo. | 3 Mos. | YTD | 1 Yr. | 3 Yrs. | 5 Yrs. | 10 Yrs. | |
| Fund at NAV | 3.10 | 2.09 | 2.09 | 2.29 | -9.21 | 1.09 | 3.73 |
| MSCI Emerging Markets Index1 | 2.48 | 2.37 | 2.37 | 8.15 | -5.05 | 2.22 | 2.94 |
| Morningstar Diversified Emerging Mkts Category6 | 2.01 | 2.70 | 2.70 | 10.31 | -3.83 | 3.23 | 2.96 |
| Past performance is no guarantee of future results. Investment return and principal value will fluctuate so that shares, when redeemed, may be worth more or less than their original cost. Performance is for the stated time period only; due to market volatility, the Fund’s current performance may be lower or higher than quoted. Returns are historical and are calculated by determining the percentage change in net asset value (NAV) with all distributions reinvested. Returns for other classes of shares offered by the Fund are different. Performance less than or equal to one year is cumulative. Performance prior to December 31, 2016 reflects the performance of the Fund’s former adviser, Calvert Investment Management, Inc. The share class has no sales charge. | |||||||
| 2014 | 2015 | 2016 | 2017 | 2018 | 2019 | 2020 | 2021 | 2022 | 2023 | |
| Fund at NAV | -1.03 | -7.39 | 6.83 | 44.71 | -15.23 | 22.66 | 24.87 | -7.43 | -22.58 | 4.73 |
| MSCI Emerging Markets Index1 | -2.19 | -14.92 | 11.19 | 37.28 | -14.57 | 18.42 | 18.31 | -2.54 | -20.09 | 9.83 |
| Class I Inception | 10/29/2012 |
| Expense Ratio (Gross)2 | 1.03% |
| Expense Ratio (Net)2,3 | 0.99% |
| Distribution Frequency | Annually |
| Alpha (%) | -4.00 |
| Beta | 1.04 |
| Information Ratio | -0.90 |
| R-Squared (%) | 94.33 |
| Standard Deviation (%) | 19.10 |
| Sharpe Ratio | -0.62 |
| Time Period | Rating | Funds in Diversified Emerging Mkts Category |
| Overall | 721 | |
| 3 Years | 721 | |
| 5 Years | 657 | |
| 10 Years | 425 | |
| The Morningstar Rating™ for funds, or "star rating", is calculated for managed products (including mutual funds and exchange-traded funds) with at least a three-year history. Exchange-traded funds and open-ended mutual funds are considered a single population for comparative purposes. It is calculated based on a Morningstar Risk-Adjusted Return measure that accounts for variation in a managed product's monthly excess performance, placing more emphasis on downward variations and rewarding consistent performance. The top 10% of products in each product category receive 5 stars, the next 22.5% receive 4 stars, the next 35% receive 3 stars, the next 22.5% receive 2 stars, and the bottom 10% receive 1 star. The Overall Morningstar Rating for a managed product is derived from a weighted average of the performance figures associated with its three-, five-, and 10-year (if applicable) Morningstar Rating metrics. The weights are: 100% three-year rating for 36-59 months of total returns, 60% five-year rating/40% three-year rating for 60-119 months of total returns, and 50% 10-year rating/30% five-year rating/20% three-year rating for 120 or more months of total returns. While the 10-year overall star rating formula seems to give the most weight to the 10-year period, the most recent three-year period actually has the greatest impact because it is included in all three rating periods. Star ratings do not reflect the effect of any applicable sales load. Hollow stars denote Morningstar Extended Performance Ratings and are considered estimates based on the performance of the fund's oldest share class, adjusted for fees and expenses. ©2024 Morningstar. All Rights Reserved. The information contained herein: (1) is proprietary to Morningstar and/or its content providers; (2) may not be copied or distributed; and (3) is not warranted to be accurate, complete or timely. Neither Morningstar nor its content providers are responsible for any damages or losses arising from any use of this information. |
| Date | NAV | NAV Change |
| Apr 17, 2024 | $16.10 | -$0.03 |
| Apr 16, 2024 | $16.13 | -$0.23 |
| Apr 15, 2024 | $16.36 | -$0.18 |
| Apr 12, 2024 | $16.54 | -$0.41 |
| Apr 11, 2024 | $16.95 | $0.06 |
| Apr 10, 2024 | $16.89 | -$0.14 |
| Apr 09, 2024 | $17.03 | $0.09 |
| Apr 08, 2024 | $16.94 | $0.05 |
| Apr 05, 2024 | $16.89 | $0.06 |
| Apr 04, 2024 | $16.83 | -$0.05 |
| Ex-Date | Distribution | Reinvest NAV |
| Dec 21, 2023 | $0.14980 | $15.98 |
| Dec 29, 2022 | $0.12350 | $15.91 |
| Dec 29, 2021 | $0.15500 | $20.25 |
| No records in this table indicates that there has not been a distribution greater than .0001 within the past 3 years. Fund prospectus |
| Ex-Date | Short-Term | Long-Term | Reinvest NAV |
| No records in this table indicates that there has not been a capital gain greater than .0001 within the past 3 years. Fund prospectus |
Portfolio profile subject to change due to active management. Percentages may not total 100% due to rounding.
RISK CONSIDERATIONS
The value of investments held by the Fund may increase or decrease in response to economic, and financial events (whether real, expected or perceived) in the U.S. and global markets. The value of equity securities is sensitive to stock market volatility. Investments in foreign instruments or currencies can involve greater risk and volatility than U.S. investments because of adverse market, economic, political, regulatory, geopolitical, currency exchange rates or other conditions. In emerging countries, these risks may be more significant. Investing primarily in responsible investments carries the risk that, under certain market conditions, the Fund may underperform funds that do not utilize a responsible investment strategy. The Fund is exposed to liquidity risk when trading volume, lack of a market maker or trading partner, large position size, market conditions, or legal restrictions impair its ability to sell particular investments or to sell them at advantageous market prices. The impact of the coronavirus on global markets could last for an extended period and could adversely affect the Fund’s performance. No fund is a complete investment program and you may lose money investing in a fund. The Fund may engage in other investment practices that may involve additional risks and you should review the Fund prospectus for a complete description.
Portfolio
|
|
|
| Foreign Common Stocks | 96.51 |
| U.S. Common Stocks | 1.96 |
| Cash | 1.52 |
| Total | 100.00 |
| Number of Holdings | 57 |
|
|
||
| Sector | Fund | MSCI Emerging Markets Index1 |
| Comm. Services | 7.70 | 8.62 |
| Consumer Discretionary | 13.17 | 12.41 |
| Consumer Staples | 3.16 | 5.64 |
| Energy | — | 5.32 |
| Financials | 25.97 | 22.35 |
| Health Care | 3.78 | 3.47 |
| Industrials | 8.22 | 6.95 |
| Information Technology | 31.08 | 23.73 |
| Materials | 4.53 | 7.20 |
| Real Estate | 0.87 | 1.52 |
| Utilities | — | 2.78 |
| Cash | 1.52 | — |
| China | 24.09 |
| Taiwan | 18.08 |
| Korea | 14.52 |
| India | 14.07 |
| South Africa | 6.04 |
| Brazil | 4.77 |
| Indonesia | 3.05 |
| Mexico | 3.00 |
| Hungary | 2.50 |
| Chile | 2.21 |
| Total | 100.00 |
| View All |

|
|
|
| Asia/Pacific | 75.00 |
| Latin America/Caribbean | 9.98 |
| Africa | 6.04 |
| Europe | 3.72 |
| North America | 1.96 |
| MiddleEast | 1.77 |
| Cash & Other Assets | 1.52 |
| Total | 100.00 |
| Holding | % of Net Assets |
| Taiwan Semiconductor Manufacturing Co Ltd | 9.97% |
| Samsung Electronics Co Ltd | 7.11% |
| Prosus NV | 4.56% |
| Tencent Holdings Ltd | 4.09% |
| Bank Rakyat Indonesia Persero Tbk PT | 3.11% |
| Infosys Ltd | 3.07% |
| AIA Group Ltd | 3.06% |
| ICICI Bank Ltd | 2.64% |
| Itausa SA | 2.62% |
| Richter Gedeon Nyrt | 2.49% |
| View All |
Portfolio profile subject to change due to active management. Percentages may not total 100% due to rounding.
RISK CONSIDERATIONS
The value of investments held by the Fund may increase or decrease in response to economic, and financial events (whether real, expected or perceived) in the U.S. and global markets. The value of equity securities is sensitive to stock market volatility. Investments in foreign instruments or currencies can involve greater risk and volatility than U.S. investments because of adverse market, economic, political, regulatory, geopolitical, currency exchange rates or other conditions. In emerging countries, these risks may be more significant. Investing primarily in responsible investments carries the risk that, under certain market conditions, the Fund may underperform funds that do not utilize a responsible investment strategy. The Fund is exposed to liquidity risk when trading volume, lack of a market maker or trading partner, large position size, market conditions, or legal restrictions impair its ability to sell particular investments or to sell them at advantageous market prices. The impact of the coronavirus on global markets could last for an extended period and could adversely affect the Fund’s performance. No fund is a complete investment program and you may lose money investing in a fund. The Fund may engage in other investment practices that may involve additional risks and you should review the Fund prospectus for a complete description.
Management
Kunjal Gala
Co-Portfolio Manager, Federated Hermes
Joined Federated Hermes 2012
Biography
Kunjal Gala is lead portfolio manager, emerging markets for Federated Hermes, a subadvisor to Calvert. He joined Federated Hermes, in 2012.
Kunjal began his career in the investment management industry in 2004. Before joining Federated Hermes, he worked as an assistant director in The Shareholder Executive, the in-house portfolio management and corporate finance arm of the UK government. Previously, he was a senior financial analyst in the investment banking division of Morgan Stanley in India and subsequently London, and worked at Thomas Cook (India) and PricewaterhouseCoopers (PwC) in India.
Kunjal earned a Bachelor of Commerce from Mumbai University. He is a qualified Chartered Accountant from the Institute of Chartered Accountants in India.
Education
- B.Comm. Mumbai University
Experience
- Managed Fund since 2019
Vivek Bhutoria, CFA
Co-Portfolio Manager, Federated Hermes
Joined Federated Hermes 2019
Biography
Vivek has 14 years of experience working in emerging market equities. He joined the international business of Federated Hermes in September 2019 as a senior analyst in the Emerging Markets team, focusing on idea generation across the Asia ex-Japan region.
Vivek's previous experience spans both the buy side and sell side. Prior to joining, he was a senior analyst with NN Investment Partners (formerly ING Investment Management) in the global emerging equity team. Vivek also worked at Deutsche Bank and BNY Mellon Asset Management covering emerging markets equities. Vivek began his career in accounting and held positions with PricewaterhouseCoopers and Ernst & Young.
Vivek has a Master of Commerce degree from Mumbai University. He is a qualified Chartered Accountant (ACA) from the Institute of Chartered Accountants of India and a CFA charterholder.
Education
- M.Comm. Mumbai University
Experience
- Managed Fund since 2022
Christopher Clube
Co-Portfolio Manager, Federated Hermes
Joined Federated Hermes 2018
Biography
Chris joined in 2018 as an investment analyst on the Global Emerging Markets team.
He joined from Amundi Pioneer Asset Management (formerly Pioneer Asset Management) where he was a Vice President in their emerging markets equity team. His role there was as an investment analyst focusing on smaller companies in emerging markets. Prior to this, he spent three years as an investment analyst focusing on the consumer and healthcare sectors across emerging markets. He also spent a year working in the emerging markets strategy team.
Chris has a BA (first class) in Classics from Oxford University.
Education
- B.A. Oxford University
Experience
- Managed Fund since 2022
Literature
Literature

Fact Sheet
Download Fact Sheet - Last updated: Dec 31, 2024
Commentary
Download Commentary - Last updated: Dec 31, 2024
Attribution
Download Attribution - Last updated: Dec 31, 2023

Annual Report
Download Annual Report - Last updated: Sep 30, 2023

Enhanced Fact Sheet
Download Enhanced Fact Sheet - Last updated: Dec 31, 2023

Full Prospectus
Download Full Prospectus - Last updated: Feb 1, 2024
Q1 Holdings
Download Q1 Holdings - Last updated: Dec 31, 2023
Q3 Holdings
Download Q3 Holdings - Last updated: Jun 30, 2023
Holdings - Form N-PORT

SAI
Download SAI - Last updated: Feb 1, 2024

Semi-Annual Report
Download Semi-Annual Report - Last updated: Mar 31, 2023

Summary Prospectus
Download Summary Prospectus - Last updated: Feb 1, 2024
