
Overview
|
|
|||||||
| Annualized | |||||||
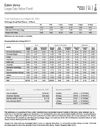
| 1 Mo. | 3 Mos. | YTD | 1 Yr. | 3 Yrs. | 5 Yrs. | 10 Yrs. | |
| Fund at NAV | 2.15 | 6.67 | 6.67 | 24.19 | 8.02 | 8.79 | 5.15 |
| Fund w/Max Sales Charge | -3.23 | 1.10 | 1.10 | 17.63 | 6.08 | 7.63 | 4.53 |
| MSCI Emerging Markets Equal Country Weighted Index1 | -0.07 | 0.98 | 0.98 | 14.77 | 5.39 | 3.73 | 1.79 |
| MSCI Emerging Markets Index2 | 2.48 | 2.37 | 2.37 | 8.15 | -5.05 | 2.22 | 2.94 |
| MSCI Frontier Markets Index3 | 4.15 | 5.25 | 5.25 | 13.97 | 0.92 | 3.02 | 1.79 |
| Past performance is no guarantee of future results. Investment return and principal value will fluctuate so that shares, when redeemed, may be worth more or less than their original cost. Performance is for the stated time period only; due to market volatility, the Fund's current performance may be lower or higher than quoted. Returns are historical and are calculated by determining the percentage change in net asset value (NAV) with all distributions reinvested. Returns for other classes of shares offered by the Fund are different. Performance less than or equal to one year is cumulative. Total return prior to the commencement of the class reflects returns of the Global Macro Capital Opportunities Portfolio, the separate registered investment company in which the Fund invests. Prior returns are adjusted to reflect any applicable sales charge (but were not adjusted for other expenses). If adjusted for other expenses, returns would be lower. Prior to 5/2/17, Fund was called Eaton Vance Global Macro Capital Opportunities Fund. Max Sales Charge: 5.25%. | |||||||
| Class A Inception | 11/03/2014 |
| Performance Inception | 11/01/2013 |
| Investment Objective | Total return |
| Total Net Assets | $775.1M |
| Minimum Investment | $1000 |
| Expense Ratio (Gross)4 | 1.55% |
| Expense Ratio (Net)4,5 | 1.40% |
| CUSIP | 27826A789 |
| Taiwan Semiconductor Manufacturing | 4.5 |
| Samsung Electronics Ltd | 3.3 |
| National Bank Of Greece Sa | 2.8 |
| Piraeus Financial Holdings Sa | 2.4 |
| Eurobank Holdings Sa | 2.2 |
| Georgia Capital Plc | 2.2 |
| Bank Of Cyprus Holding Plc | 1.9 |
| Mytilineos Sa | 1.8 |
| Alpha Services And Holdings Sa | 1.7 |
| Bank Of Georgia Group Plc | 1.7 |
| Total | 24.5 |
| Time Period | Rating | Funds in Diversified Emerging Mkts Category |
| Overall | 721 | |
| 3 Years | 721 | |
| 5 Years | 657 | |
| 10 Years | 425 | |
| The Morningstar Rating™ for funds, or "star rating", is calculated for managed products (including mutual funds and exchange-traded funds) with at least a three-year history. Exchange-traded funds and open-ended mutual funds are considered a single population for comparative purposes. It is calculated based on a Morningstar Risk-Adjusted Return measure that accounts for variation in a managed product's monthly excess performance, placing more emphasis on downward variations and rewarding consistent performance. The top 10% of products in each product category receive 5 stars, the next 22.5% receive 4 stars, the next 35% receive 3 stars, the next 22.5% receive 2 stars, and the bottom 10% receive 1 star. The Overall Morningstar Rating for a managed product is derived from a weighted average of the performance figures associated with its three-, five-, and 10-year (if applicable) Morningstar Rating metrics. The weights are: 100% three-year rating for 36-59 months of total returns, 60% five-year rating/40% three-year rating for 60-119 months of total returns, and 50% 10-year rating/30% five-year rating/20% three-year rating for 120 or more months of total returns. While the 10-year overall star rating formula seems to give the most weight to the 10-year period, the most recent three-year period actually has the greatest impact because it is included in all three rating periods. Star ratings do not reflect the effect of any applicable sales load. Hollow stars denote Morningstar Extended Performance Ratings and are considered estimates based on the performance of the fund's oldest share class, adjusted for fees and expenses. ©2024 Morningstar. All Rights Reserved. The information contained herein: (1) is proprietary to Morningstar and/or its content providers; (2) may not be copied or distributed; and (3) is not warranted to be accurate, complete or timely. Neither Morningstar nor its content providers are responsible for any damages or losses arising from any use of this information. |
| Steven Vanne, CFA, FRM | Managed Fund since 2023 | ||
| Federico Sequeda, CFA | Managed Fund since 2024 | ||
| Sahil Tandon, CFA | Managed Fund since 2024 |
Portfolio profile subject to change due to active management. Percentages may not total 100% due to rounding. Fund primarily invests in an affiliated investment company (Portfolio) with the same objective(s) and policies as the Fund and may also invest directly. References to investments are to the aggregate holdings of the Fund and the Portfolio.
RISK CONSIDERATIONS
The value of investments held by the Fund may increase or decrease in response to economic, and financial events (whether real, expected or perceived) in the U.S. and global markets. The value of equity securities is sensitive to stock market volatility. When interest rates rise, the value of preferred stocks will generally decline. Investments in foreign instruments or currencies can involve greater risk and volatility than U.S. investments because of adverse market, economic, political, regulatory, geopolitical, currency exchange rates or other conditions. In emerging or frontier countries, these risks may be more significant. The Fund's exposure to derivatives involves risks different from, or possibly greater than, the risks associated with investing directly in securities and other investments. Derivatives instruments can be highly volatile, result in leverage (which can increase both the risk and return potential of the Fund), and involve risks in addition to the risks of the underlying instrument on which the derivative is based, such as counterparty, correlation and liquidity risk. If a counterparty is unable to honor its commitments, the value of Fund shares may decline and/or the Fund could experience delays in the return of collateral or other assets held by the counterparty. Because the Fund may invest significantly in a particular geographic region or country, value of Fund shares may fluctuate more than a fund with less exposure to such areas. The Fund is exposed to liquidity risk when trading volume, lack of a market maker or trading partner, large position size, market conditions, or legal restrictions impair its ability to sell particular investments or to sell them at advantageous market prices. The impact of the coronavirus on global markets could last for an extended period and could adversely affect the Fund’s performance. No fund is a complete investment program and you may lose money investing in a fund. The Fund may engage in other investment practices that may involve additional risks and you should review the Fund prospectus for a complete description.
Performance
|
|
|||||||
| Annualized | |||||||
| 1 Mo. | 3 Mos. | YTD | 1 Yr. | 3 Yrs. | 5 Yrs. | 10 Yrs. | |
| Fund at NAV | 2.15 | 6.67 | 6.67 | 24.19 | 8.02 | 8.79 | 5.15 |
| Fund w/Max Sales Charge | -3.23 | 1.10 | 1.10 | 17.63 | 6.08 | 7.63 | 4.53 |
| MSCI Emerging Markets Equal Country Weighted Index1 | -0.07 | 0.98 | 0.98 | 14.77 | 5.39 | 3.73 | 1.79 |
| MSCI Emerging Markets Index2 | 2.48 | 2.37 | 2.37 | 8.15 | -5.05 | 2.22 | 2.94 |
| MSCI Frontier Markets Index3 | 4.15 | 5.25 | 5.25 | 13.97 | 0.92 | 3.02 | 1.79 |
| Morningstar Diversified Emerging Mkts Category7 | 2.01 | 2.70 | 2.70 | 10.31 | -3.83 | 3.23 | 2.96 |
| Past performance is no guarantee of future results. Investment return and principal value will fluctuate so that shares, when redeemed, may be worth more or less than their original cost. Performance is for the stated time period only; due to market volatility, the Fund's current performance may be lower or higher than quoted. Returns are historical and are calculated by determining the percentage change in net asset value (NAV) with all distributions reinvested. Returns for other classes of shares offered by the Fund are different. Performance less than or equal to one year is cumulative. Total return prior to the commencement of the class reflects returns of the Global Macro Capital Opportunities Portfolio, the separate registered investment company in which the Fund invests. Prior returns are adjusted to reflect any applicable sales charge (but were not adjusted for other expenses). If adjusted for other expenses, returns would be lower. Prior to 5/2/17, Fund was called Eaton Vance Global Macro Capital Opportunities Fund. Max Sales Charge: 5.25%. | |||||||
| 2014 | 2015 | 2016 | 2017 | 2018 | 2019 | 2020 | 2021 | 2022 | 2023 | |
| Fund at NAV | -5.50 | -13.46 | 8.23 | 31.21 | -14.76 | 12.34 | 13.19 | 13.05 | -14.83 | 25.44 |
| MSCI Emerging Markets Equal Country Weighted Index1 | -4.09 | -19.48 | 11.95 | 26.42 | -12.47 | 12.49 | -2.20 | 6.16 | -6.36 | 16.71 |
| MSCI Emerging Markets Index2 | -2.19 | -14.92 | 11.19 | 37.28 | -14.57 | 18.42 | 18.31 | -2.54 | -20.09 | 9.83 |
| MSCI Frontier Markets Index3 | 6.84 | -14.46 | 2.66 | 31.86 | -16.41 | 17.99 | 1.43 | 19.73 | -26.34 | 11.63 |
| Class A Inception | 11/03/2014 |
| Performance Inception | 11/01/2013 |
| Expense Ratio (Gross)4 | 1.55% |
| Expense Ratio (Net)4,5 | 1.40% |
| Alpha (%) | 3.61 |
| Beta | 0.80 |
| Standard Deviation (%) | 14.61 |
| Sharpe Ratio | 0.37 |
| Downside Market Capture Ratio (%) | 77.59 |
| Time Period | Rating | Funds in Diversified Emerging Mkts Category |
| Overall | 721 | |
| 3 Years | 721 | |
| 5 Years | 657 | |
| 10 Years | 425 | |
| The Morningstar Rating™ for funds, or "star rating", is calculated for managed products (including mutual funds and exchange-traded funds) with at least a three-year history. Exchange-traded funds and open-ended mutual funds are considered a single population for comparative purposes. It is calculated based on a Morningstar Risk-Adjusted Return measure that accounts for variation in a managed product's monthly excess performance, placing more emphasis on downward variations and rewarding consistent performance. The top 10% of products in each product category receive 5 stars, the next 22.5% receive 4 stars, the next 35% receive 3 stars, the next 22.5% receive 2 stars, and the bottom 10% receive 1 star. The Overall Morningstar Rating for a managed product is derived from a weighted average of the performance figures associated with its three-, five-, and 10-year (if applicable) Morningstar Rating metrics. The weights are: 100% three-year rating for 36-59 months of total returns, 60% five-year rating/40% three-year rating for 60-119 months of total returns, and 50% 10-year rating/30% five-year rating/20% three-year rating for 120 or more months of total returns. While the 10-year overall star rating formula seems to give the most weight to the 10-year period, the most recent three-year period actually has the greatest impact because it is included in all three rating periods. Star ratings do not reflect the effect of any applicable sales load. Hollow stars denote Morningstar Extended Performance Ratings and are considered estimates based on the performance of the fund's oldest share class, adjusted for fees and expenses. ©2024 Morningstar. All Rights Reserved. The information contained herein: (1) is proprietary to Morningstar and/or its content providers; (2) may not be copied or distributed; and (3) is not warranted to be accurate, complete or timely. Neither Morningstar nor its content providers are responsible for any damages or losses arising from any use of this information. |
| Date | NAV | NAV Change |
| Apr 17, 2024 | $13.33 | -$0.02 |
| Apr 16, 2024 | $13.35 | -$0.20 |
| Apr 15, 2024 | $13.55 | -$0.17 |
| Apr 12, 2024 | $13.72 | -$0.23 |
| Apr 11, 2024 | $13.95 | $0.02 |
| Apr 10, 2024 | $13.93 | -$0.05 |
| Apr 09, 2024 | $13.98 | $0.05 |
| Apr 08, 2024 | $13.93 | $0.10 |
| Apr 05, 2024 | $13.83 | $0.09 |
| Apr 04, 2024 | $13.74 | $0.01 |
| Ex-Date | Distribution | Reinvest NAV |
| Dec 28, 2023 | $0.23360 | $12.90 |
| Dec 29, 2022 | $0.58580 | $10.48 |
| Dec 29, 2021 | $0.09590 | $12.92 |
| No records in this table indicates that there has not been a distribution greater than .0001 within the past 3 years. Fund prospectus |
| Ex-Date | Short-Term | Long-Term | Reinvest NAV |
| Dec 29, 2021 | $0.21780 | $12.92 | |
| No records in this table indicates that there has not been a capital gain greater than .0001 within the past 3 years. Fund prospectus |
Portfolio profile subject to change due to active management. Percentages may not total 100% due to rounding. Fund primarily invests in an affiliated investment company (Portfolio) with the same objective(s) and policies as the Fund and may also invest directly. References to investments are to the aggregate holdings of the Fund and the Portfolio.
RISK CONSIDERATIONS
The value of investments held by the Fund may increase or decrease in response to economic, and financial events (whether real, expected or perceived) in the U.S. and global markets. The value of equity securities is sensitive to stock market volatility. When interest rates rise, the value of preferred stocks will generally decline. Investments in foreign instruments or currencies can involve greater risk and volatility than U.S. investments because of adverse market, economic, political, regulatory, geopolitical, currency exchange rates or other conditions. In emerging or frontier countries, these risks may be more significant. The Fund's exposure to derivatives involves risks different from, or possibly greater than, the risks associated with investing directly in securities and other investments. Derivatives instruments can be highly volatile, result in leverage (which can increase both the risk and return potential of the Fund), and involve risks in addition to the risks of the underlying instrument on which the derivative is based, such as counterparty, correlation and liquidity risk. If a counterparty is unable to honor its commitments, the value of Fund shares may decline and/or the Fund could experience delays in the return of collateral or other assets held by the counterparty. Because the Fund may invest significantly in a particular geographic region or country, value of Fund shares may fluctuate more than a fund with less exposure to such areas. The Fund is exposed to liquidity risk when trading volume, lack of a market maker or trading partner, large position size, market conditions, or legal restrictions impair its ability to sell particular investments or to sell them at advantageous market prices. The impact of the coronavirus on global markets could last for an extended period and could adversely affect the Fund’s performance. No fund is a complete investment program and you may lose money investing in a fund. The Fund may engage in other investment practices that may involve additional risks and you should review the Fund prospectus for a complete description.
Portfolio
| Number of Countries | 16 |
| Emerging-Market Exposure | 85.91% |
| Frontier-Market Exposure | 13.11% |
| Off-Index Exposure | 8.4% |
| Active Share10 | 50.00% |
|
|
||
| Sector | Fund | Primary Benchmark |
| Comm. Services | 5.54 | 5.56 |
| Consumer Discretionary | 9.05 | 6.15 |
| Consumer Staples | 3.26 | 5.95 |
| Energy | 6.07 | 5.48 |
| Financials | 34.62 | 41.52 |
| Health Care | 1.15 | 2.46 |
| Industrials | 10.54 | 8.40 |
| Information Technology | 13.27 | 6.71 |
| Materials | 5.04 | 8.46 |
| Real Estate | 3.52 | 2.69 |
| Utilities | 3.63 | 6.61 |
| Fund | Primary Benchmark | |
| Greece | 20.38 | 4.02 |
| Korea | 15.70 | 4.31 |
| Poland | 9.42 | 4.25 |
| United Arab Emirates | 7.92 | 3.97 |
| Taiwan | 6.33 | 4.50 |
| MSCI Index Future | 6.24 | 0.00 |
| Vietnam | 6.03 | 0.00 |
| India | 6.00 | 4.16 |
| Saudi Arabia | 5.79 | 4.09 |
| Other Countries | 23.60 | 70.70 |
| Holding | % of Net Assets |
| MSILF GOVERNMENT PORTFOLIO | 5.28% |
| Taiwan Semiconductor Manufacturing Co Ltd | 3.08% |
| National Bank of Greece SA | 2.56% |
| Samsung Electronics Co Ltd | 2.38% |
| Eurobank Ergasias Services and Holdings SA | 2.25% |
| Georgia Capital PLC | 2.23% |
| Bank of Cyprus Holdings PLC | 1.92% |
| Alpha Services and Holdings SA | 1.87% |
| US DOLLARS | 1.76% |
| Bank of Georgia Group PLC | 1.74% |
| View All |

Portfolio profile subject to change due to active management. Percentages may not total 100% due to rounding. Fund primarily invests in an affiliated investment company (Portfolio) with the same objective(s) and policies as the Fund and may also invest directly. References to investments are to the aggregate holdings of the Fund and the Portfolio.
RISK CONSIDERATIONS
The value of investments held by the Fund may increase or decrease in response to economic, and financial events (whether real, expected or perceived) in the U.S. and global markets. The value of equity securities is sensitive to stock market volatility. When interest rates rise, the value of preferred stocks will generally decline. Investments in foreign instruments or currencies can involve greater risk and volatility than U.S. investments because of adverse market, economic, political, regulatory, geopolitical, currency exchange rates or other conditions. In emerging or frontier countries, these risks may be more significant. The Fund's exposure to derivatives involves risks different from, or possibly greater than, the risks associated with investing directly in securities and other investments. Derivatives instruments can be highly volatile, result in leverage (which can increase both the risk and return potential of the Fund), and involve risks in addition to the risks of the underlying instrument on which the derivative is based, such as counterparty, correlation and liquidity risk. If a counterparty is unable to honor its commitments, the value of Fund shares may decline and/or the Fund could experience delays in the return of collateral or other assets held by the counterparty. Because the Fund may invest significantly in a particular geographic region or country, value of Fund shares may fluctuate more than a fund with less exposure to such areas. The Fund is exposed to liquidity risk when trading volume, lack of a market maker or trading partner, large position size, market conditions, or legal restrictions impair its ability to sell particular investments or to sell them at advantageous market prices. The impact of the coronavirus on global markets could last for an extended period and could adversely affect the Fund’s performance. No fund is a complete investment program and you may lose money investing in a fund. The Fund may engage in other investment practices that may involve additional risks and you should review the Fund prospectus for a complete description.
Management
Steven Vanne, CFA, FRM
Executive Director
Joined Eaton Vance in 2013
Biography
Steve is an executive director of Morgan Stanley Investment Management and a portfolio manager on the Emerging Markets team. He is responsible for buy and sell decisions, portfolio construction and risk management for the team's emerging markets equity strategies. He joined Eaton Vance in 2013. Morgan Stanley acquired Eaton Vance in March 2021.
Steve began his career in the investment management industry in 2007. Before joining Eaton Vance, he was affiliated with State Street Bank and Trust Company.
Steve earned a Bachelor of Arts in quantitative economics from Providence College. He is a CFA charterholder and holds the Financial Risk Manager (FRM) designation.
Education
- B.A. Providence College
Experience
- Managed Fund since 2023

Federico Sequeda, CFA
Executive Director, Portfolio Manager
Joined Eaton Vance 2010
Biography
Federico Sequeda is a portfolio manager on the Emerging Markets team. He is responsible for buy and sell decisions, portfolio construction and risk management for the team's emerging markets strategies. He joined Eaton Vance in 2010. Morgan Stanley acquired Eaton Vance in March 2021.
Federico began his career in the investment management industry in 2009. Before joining Eaton Vance, he was an investment associate with Bridgewater Associates, LP.
Federico earned a B.A., magna cum laude, from Dartmouth College. He is a CFA charterholder.
Education
- B.A. Dartmouth College
Experience
- Managed Fund since 2024
Other funds managed
Sahil Tandon, CFA
Managing Director, Portfolio Manager
Joined Morgan Stanley in 2004
Biography
Sahil Tandon is a portfolio manager on the Emerging Markets team.
He joined Morgan Stanley in 2004, where he began his career in the investment industry.
Sahil earned a B.A. in economics from Brandeis University. He holds the Chartered Financial Analyst designation. He is a member of the CFA Institute and the New York Society of Security Analysts.
Education
- B.A. Brandeis University
Experience
- Managed Fund since 2024
Literature
Literature
Attribution
Download Attribution - Last updated: Mar 31, 2024

Annual Report
Download Annual Report - Last updated: Oct 31, 2023

Full Prospectus
Download Full Prospectus - Last updated: Mar 1, 2024

Q1 Holdings
Download Q1 Holdings - Last updated: Jan 31, 2024
Q3 Holdings
Download Q3 Holdings - Last updated: Jul 31, 2023
Holdings - Form N-PORT

SAI
Download SAI - Last updated: Mar 1, 2024

Semi-Annual Report
Download Semi-Annual Report - Last updated: Apr 30, 2023

Summary Prospectus
Download Summary Prospectus - Last updated: Mar 1, 2024
