Scroll Up Top
Download icon
Download

Federal Reserve Board1
In March, the Federal Open Market Committee (FOMC) decided to maintain the federal funds target rate at 4.25% to 4.50%. The press release took a dovish tone, highlighting that “uncertainty around the economic outlook has increased.” The release noted that the Federal Reserve (Fed) will “continue reducing its holdings of Treasury securities,” with a notable reduction in the monthly redemption cap on Treasury securities from $25 billion to $5 billion. The path ahead remains uncertain as the Fed remains data dependent in considering further rate cuts.

European Central Bank1
The European Central Bank (ECB) Governing Council lowered the key deposit rate by 25 basis points at the conclusion of its policy meeting in March to 2.50%. The ECB credited the cut to the “disinflation process” being “well on track.” On inflation, wage growth was high and prices in certain sectors continue to adjust to past inflation surges with a substantial delay. Most measures of underlying inflation suggest that inflation will settle at around the Governing Council’s 2% medium-term target on a sustained basis. The path ahead remains uncertain as the Governing Council is not pre-committing to a particular rate path and remains data dependent.

Bank of England
The Bank of England (BoE) Monetary Policy Committee (MPC) voted 8-1 to maintain the Bank Rate at 4.50% at the conclusion of its March meeting. One member preferred to reduce Bank Rate by 0.25% to 4.25%. The BoE has adopted a gradual approach in removing policy restraint in the absence of material developments. Twelve-month CPI inflation increased to 3.0% in January from 2.5% in December; domestic inflationary pressures are moderating but remain somewhat elevated. Monetary policy will remain restrictive for sufficiently long until inflation sustainably returns to its 2% target. The committee remains cautious in determining the appropriate degree of monetary easing.

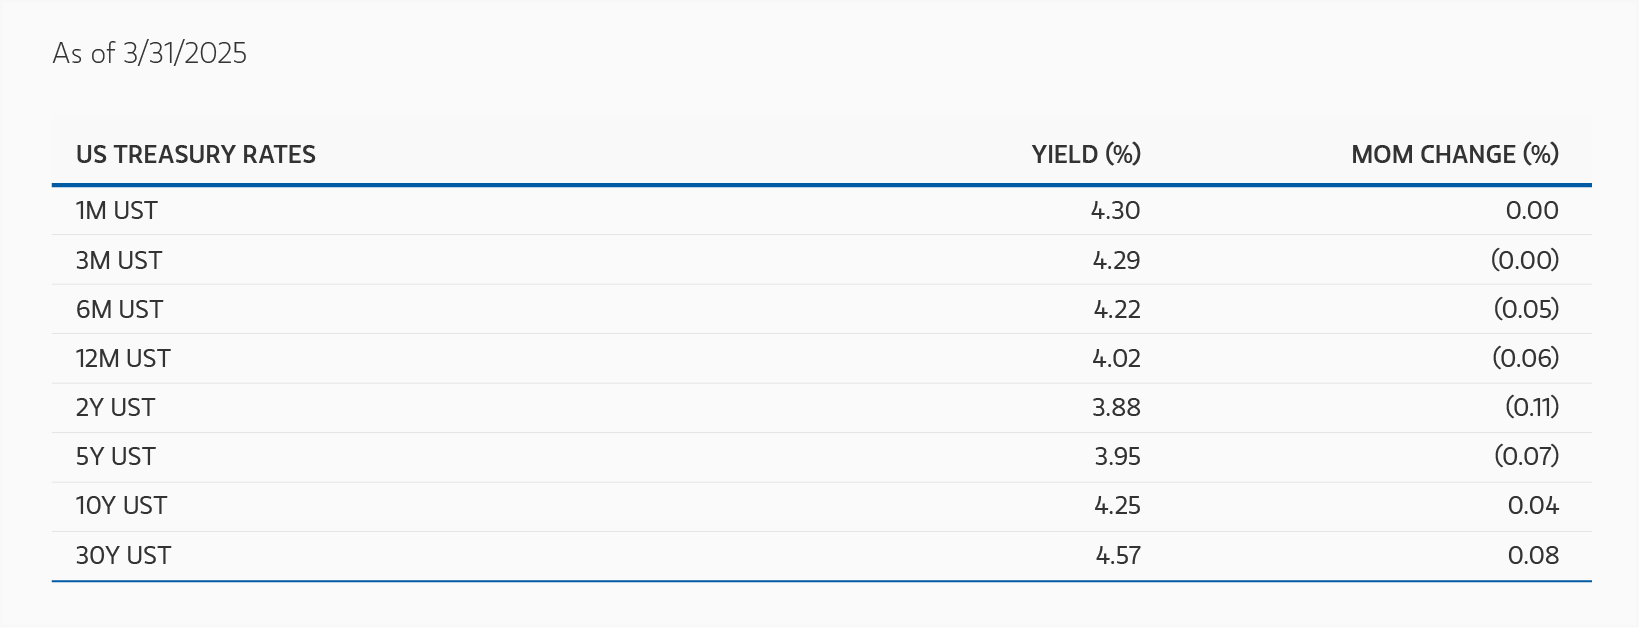
Monthly Interest Rate Summary as of 3/31/25.

DISPLAY 1
market-insight_uncertain-chord_display-1.png

Source: Bloomberg

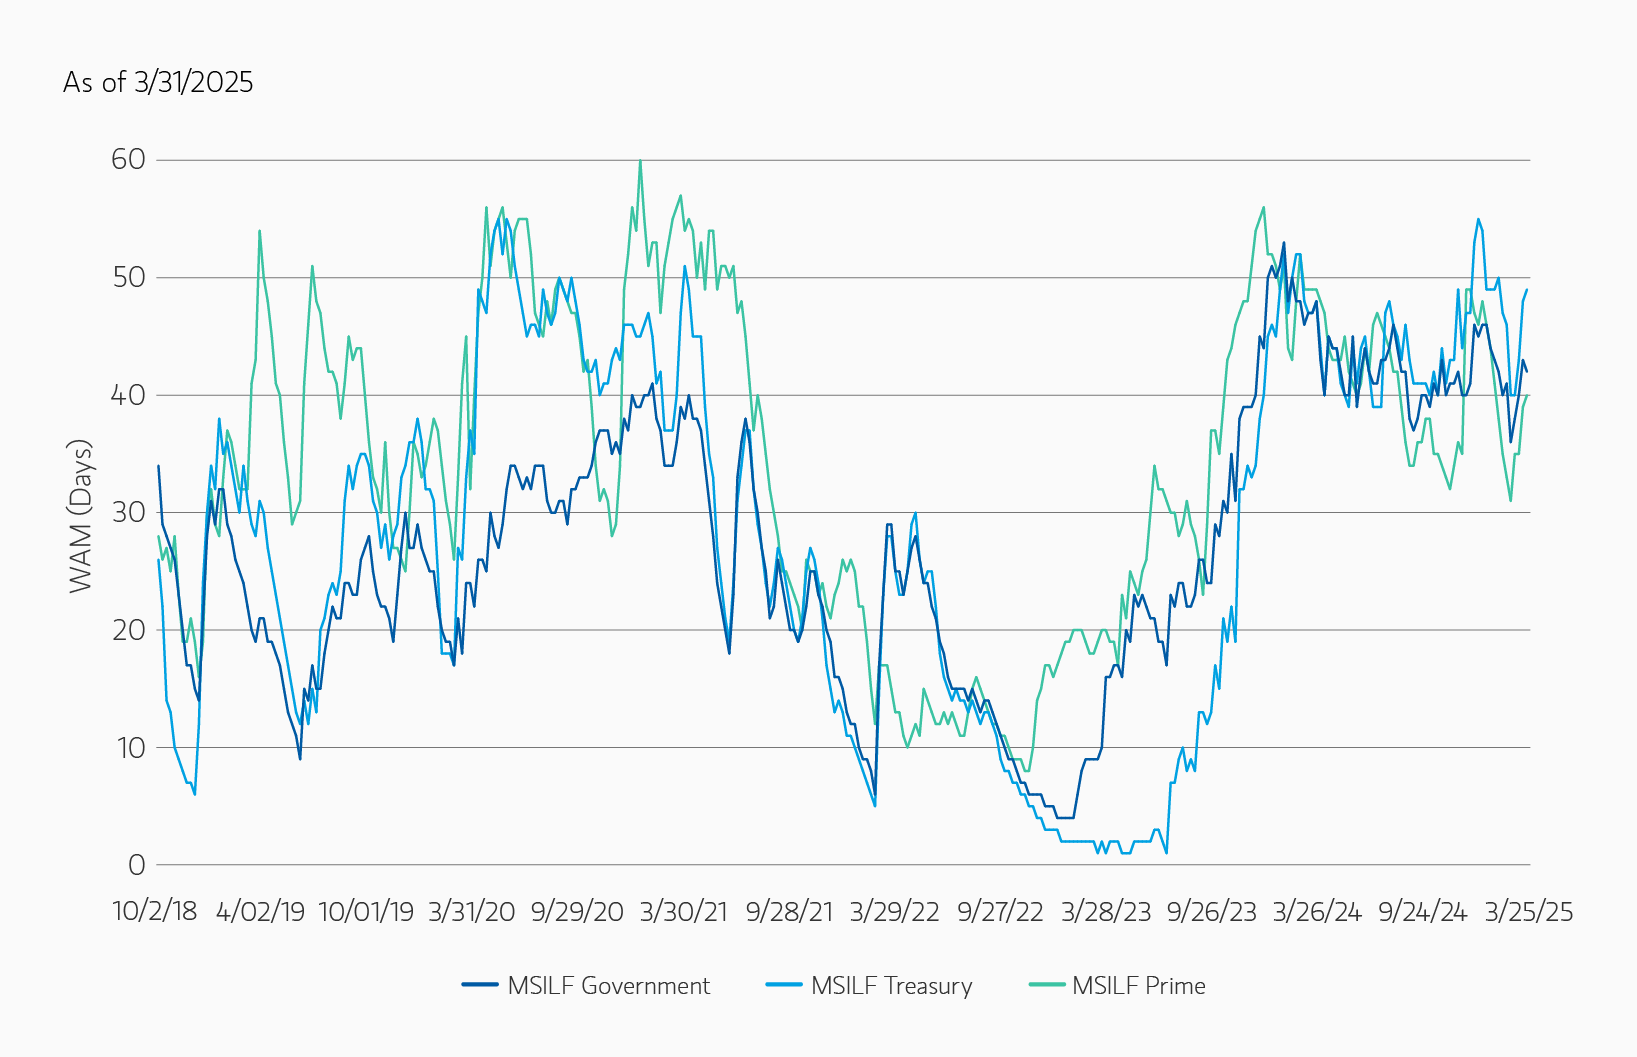
MSILF Weighted Average Maturities (WAM) Summary as of 3/31/25.2

DISPLAY 2
market-insight_uncertain-chord_display-2.png

Source: iMoneyNet 

PORTFOLIO STRATEGY

Government/Treasury Strategy
We continue to hold attractive positions in both fixed- and floating-rate securities as the money market curve is still flat. Tailwinds for SOFR (secured overnight financing rate) remained, especially around quarter-end, causing overnight and short-term floating-rate positions to be attractive. The level of uncertainty in the market has grown dramatically through the month, with a wide range of near-term outcomes for markets. As such we have maintained the portfolios’ weighted average maturity (WAM) in the mid- to low-40 days, with fixed-rate positioning that we believe is likely to perform well if the rate-cutting cycle continues through the midpoint of this year.

The market closed the month pricing roughly three rate cuts for 2025, one more than the two predicted in the Fed’s most recent dot plot. The pricing of the additional cut is likely related to growth concerns on the back of political initiatives, with many market-wide gross domestic product (GDP) measures and estimates being revised downward in the absence of further clarity on tariffs. The Fed, however, has conveyed a willingness to be patient while still seeming to indicate that the path of least resistance will be toward rate cuts, especially if officials gain further confidence on the inflation front or see weakening in labor markets.

The debt ceiling “X-date” is approaching, and tax receipts through the first half of April will be worth watching. Treasury bill auction sizes have fallen, and the potential for more ad-hoc cash management bills in the near future is rising. Market participants will need to be very diligent on the concentration of specific bonds they own as more formal information relating to the debt ceiling arises.

Prime Strategy3
Both the WAM and weighted average life (WAL) of the portfolios extended throughout the month as we took advantage of the recent sell-off in the short end of the curve and opportunistically locked in 1-year fixed-rate securities with a positive carry compared to overnight repo securities.

With credit spreads returning to a more normalized level following the year-end turn, we believe secondary market rolled-down corporate bonds continue to provide the most value and are trading dislocated, priced cheaply relative to their wholesale equivalents. We looked to add exposure mostly around month-end during index selling.

From a liquidity standpoint, dealer balance sheets remain unconstrained, which is one of the main reasons for the spread tightening in the first quarter of the year.


1 Source: Bloomberg
2 Weighted Average Maturity (WAM): Measures the weighted average of the maturities of the portfolio’s individual holdings, taking into account reset dates for floating rate securities.
3 The Portfolio will be required to price and transact in their shares at a floating net asset value (“NAV”).

The views and opinions expressed are those of the Portfolio Management team as of March 31, 2025 and are subject to change based on market, economic and other conditions. Past performance is not indicative of future results.

Global Liquidity Solutions

The Global Liquidity team aims to effectively meet clients’ unique cash and working capital needs, offering a broad range of money market funds, ultra-short bond funds and customized separate account solutions.

One basis point = 0.01%

The index performance is provided for illustrative purposes only and is not meant to depict the performance of a specific investment.

The views and opinions and/or analysis expressed are those of the author or the investment team as of the date of preparation of this material and are subject to change at any time without notice due to market or economic conditions and may not necessarily come to pass. Furthermore, the views will not be updated or otherwise revised to reflect information that subsequently becomes available or circumstances existing, or changes occurring, after the date of publication. The views expressed do not reflect the opinions of all investment personnel at Morgan Stanley Investment Management (MSIM) and its subsidiaries and affiliates (collectively the Firm”) or the views of the firm as a whole, and may not be reflected in all the strategies and products that the Firm offers.

Forecasts and/or estimates provided herein are subject to change and may not actually come to pass.  Information regarding expected market returns and market outlooks is based on the research, analysis and opinions of the authors or investment team. These conclusions are speculative in nature, may not come to pass and are not intended to predict the future performance of any specific strategy or product the Firm offers. Future results may differ significantly depending on factors such as changes in securities or financial markets or general economic conditions.

This material has been prepared on the basis of publicly available information, internally developed data and other third-party sources believed to be reliable. However, no assurances are provided regarding the reliability of such information and the Firm has not sought to independently verify information taken from public and third-party sources.

This material is a general communication, which is not impartial and all information provided has been prepared solely for informational and educational purposes and does not constitute an offer or a recommendation to buy or sell any particular security or to adopt any specific investment strategy. The information herein has not been based on a consideration of any individual investor circumstances and is not investment advice, nor should it be construed in any way as tax, accounting, legal or regulatory advice. To that end, investors should seek independent legal and financial advice, including advice as to tax consequences, before making any investment decision.

Charts and graphs provided herein are for illustrative purposes only. Past performance is no guarantee of future results.

The indexes are unmanaged and do not include any expenses, fees or sales charges. It is not possible to invest directly in an index. Any index referred to herein is the intellectual property (including registered trademarks) of the applicable licensor. Any product based on an index is in no way sponsored, endorsed, sold or promoted by the applicable licensor and it shall not have any liability with respect thereto.

This material is not a product of Morgan Stanley’s Research Department and should not be regarded as a research material or a recommendation. Current and future portfolio holdings are subject to change. The forecasts in this piece are not necessarily those of Morgan Stanley, and may not actually come to pass.

Certain information herein is based on data obtained from third party sources believed to be reliable. However, we have not verified this information, and we make no representations whatsoever as to its accuracy or completeness.

Please consider the investment objectives, risks, charges and expenses of the portfolios carefully before investing. The prospectus contains this and other information about the portfolios. To obtain a prospectus, download one at www.morganstanley.com/liquidity or call 1.800.236.0992. Please read the prospectus carefully before investing.

There is no assurance that a portfolio will achieve its investment objective. Portfolios are subject to market risk, which is the possibility that the market values of securities owned by the portfolio will decline and that the value of portfolio shares may therefore be less than what you paid for them. Market values can change daily due to economic and other events (e.g. natural disasters, health crises, terrorism, conflicts and social unrest) that affect markets, countries, companies or governments. It is difficult to predict the timing, duration, and potential adverse effects (e.g. portfolio liquidity) of events.

STABLE NAV FUNDS

You could lose money by investing in the Fund. Although the Fund seeks to preserve the value of your investment at $1.00 per share, it cannot guarantee it will do so. An investment in the Fund is not a bank account and is not insured or guaranteed by the Federal Deposit Insurance Corporation or any other government agency. The Fund’s sponsor is not required to reimburse the Fund for losses, and you should not expect that the sponsor will provide financial support to the Fund at any time, including during periods of market stress.

FLOATING NAV FUNDS

You could lose money by investing in the Fund. Because the share price of the Fund will fluctuate, when you sell your shares they may be worth more or less than what you originally paid for them. The Fund may impose a fee upon sale of your shares. The Fund generally must impose a fee when net sales of Fund shares exceed certain levels. An investment in the Fund is not a bank account and is not insured or guaranteed by the Federal Deposit Insurance Corporation or any other government agency. The Fund’s sponsor is not required to reimburse the Fund for losses, and you should not expect that the sponsor will provide financial support to the Fund at any time, including during periods of market stress. The Portfolio will be required to price and transact in their shares at a floating Net asset value (“NAV”). The Portfolio will be required to impose a mandatory liquidity fee when the Fund experiences daily net redemptions that exceed 5% of net assets, unless the Fund’s liquidity costs are de minimis.

The Tax-Exempt Portfolio may invest a portion of its total assets in bonds that may subject certain investors to the federal Alternative Minimum Tax (AMT). Investors should consult their tax adviser for further information on tax implications.

Morgan Stanley Investment Management is the asset management division of Morgan Stanley.

NOT FDIC INSURED | OFFER NO BANK GUARANTEE | MAY LOSE VALUE | NOT INSURED BY ANY FEDERAL GOVERNMENT AGENCY | NOT A BANK DEPOSIT