Scroll Up Top
Download icon
Download

Global Fixed Income Market Recap

Rates Reprice Higher Amid Resilient Growth and Sticky Inflation

Global government bond yields rose across most developed markets in July, led by the U.S. 10-year yield, which climbed ~15 basis point (bps) to 4.37%, reflecting stronger-than-expected economic data and persistent inflation pressures. Canada (+18 bps) and Japan (+12.5 bps) also saw notable moves, while Germany (+9 bps) and the UK (+8 bps) followed suit. The upward pressure on yields was broad-based, driven by hawkish central bank rhetoric and a reassessment of terminal rate expectations.

Credit Markets Rally on Technicals and Risk Appetite

Credit spreads tightened across the board, supported by strong fundamentals and demand. U.S. Investment Grade (IG) spreads narrowed by 7 bps to 76, while U.S. High Yield (HY) tightened by 12 bps to 278, with similar moves in Euro IG (-13 bps) and Euro HY (-30 bps). Emerging Markets (EM) corporates and sovereigns saw meaningful spread compression, with EM External spreads tighter by 24 bps and EM Corporate spreads tighter by 26 bps, reflecting improved sentiment and demand.

Securitized Credit Outperforms

Agency Mortgage-Backed Securities (MBS) yields rose ~14 bps, but spreads tightened modestly, suggesting stable demand. Commercial MBS (CMBS) and Asset-Backed Securities (ABS) spreads narrowed across ratings buckets, with CMBS AAA down ~5 bps and CMBS BBB down ~20 bps, supported by improving fundamentals and technicals.

Breakevens Rise as Inflation Expectations Rebuild

Inflation breakevens widened in the U.S. (+11 bps), Germany (+6 bps), and the UK (+6 bps), indicating a rebound in inflation expectations across the globe. The move was more muted in Japan and Southern Europe.

FX Volatility Returns as USD Strengthens

The USD appreciated broadly, with notable moves against the JPY (-4.5%), EUR (-3.2%), and GBP (-3.8%). The DXY index rose ~3.2%, driven by higher U.S. yields and safe-haven flows. EM currencies were broadly lower, with BRL and ZAR weakening -3.0% and -2.7% respectively.

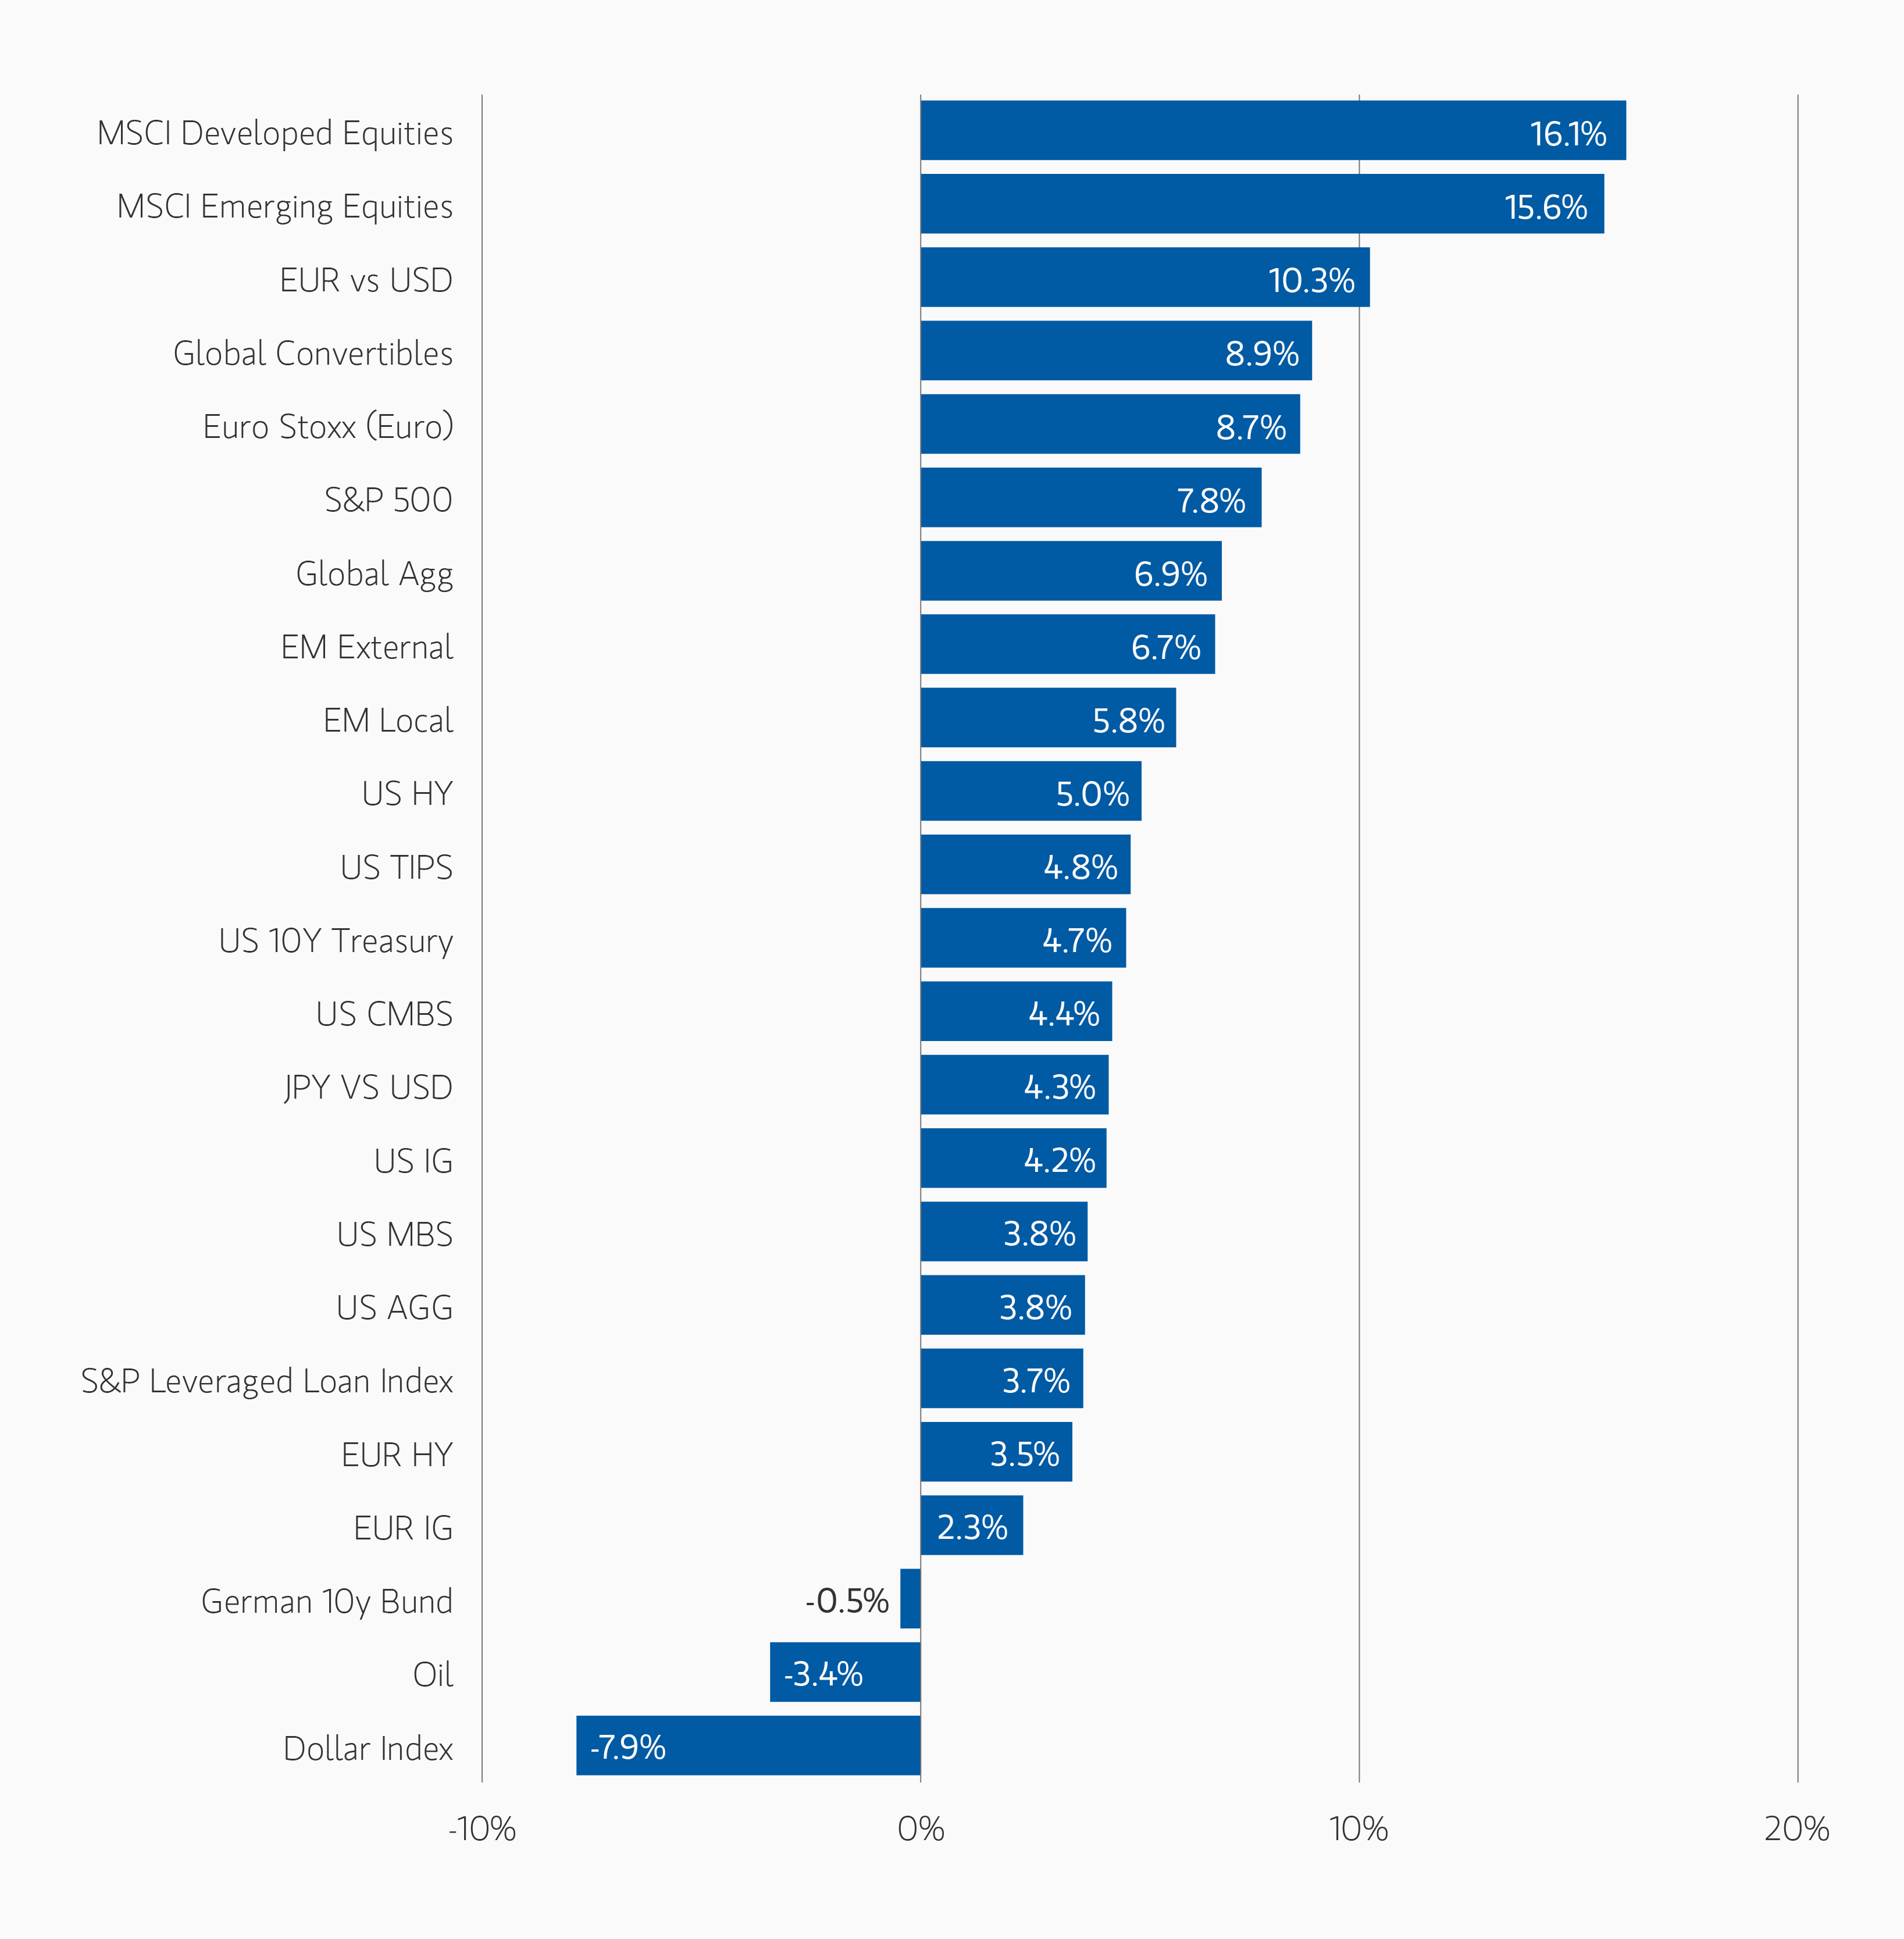
Asset Performance Year-to-Date

DISPLAY 1
insights_if-we-knew-then-display_01.png

Note: USD-based performance. Source: Bloomberg. Data as of July 31, 2025. The indexes are provided for illustrative purposes only and are not meant to depict the performance of a specific investment. Past performance is no guarantee of future results. See below for index definitions.

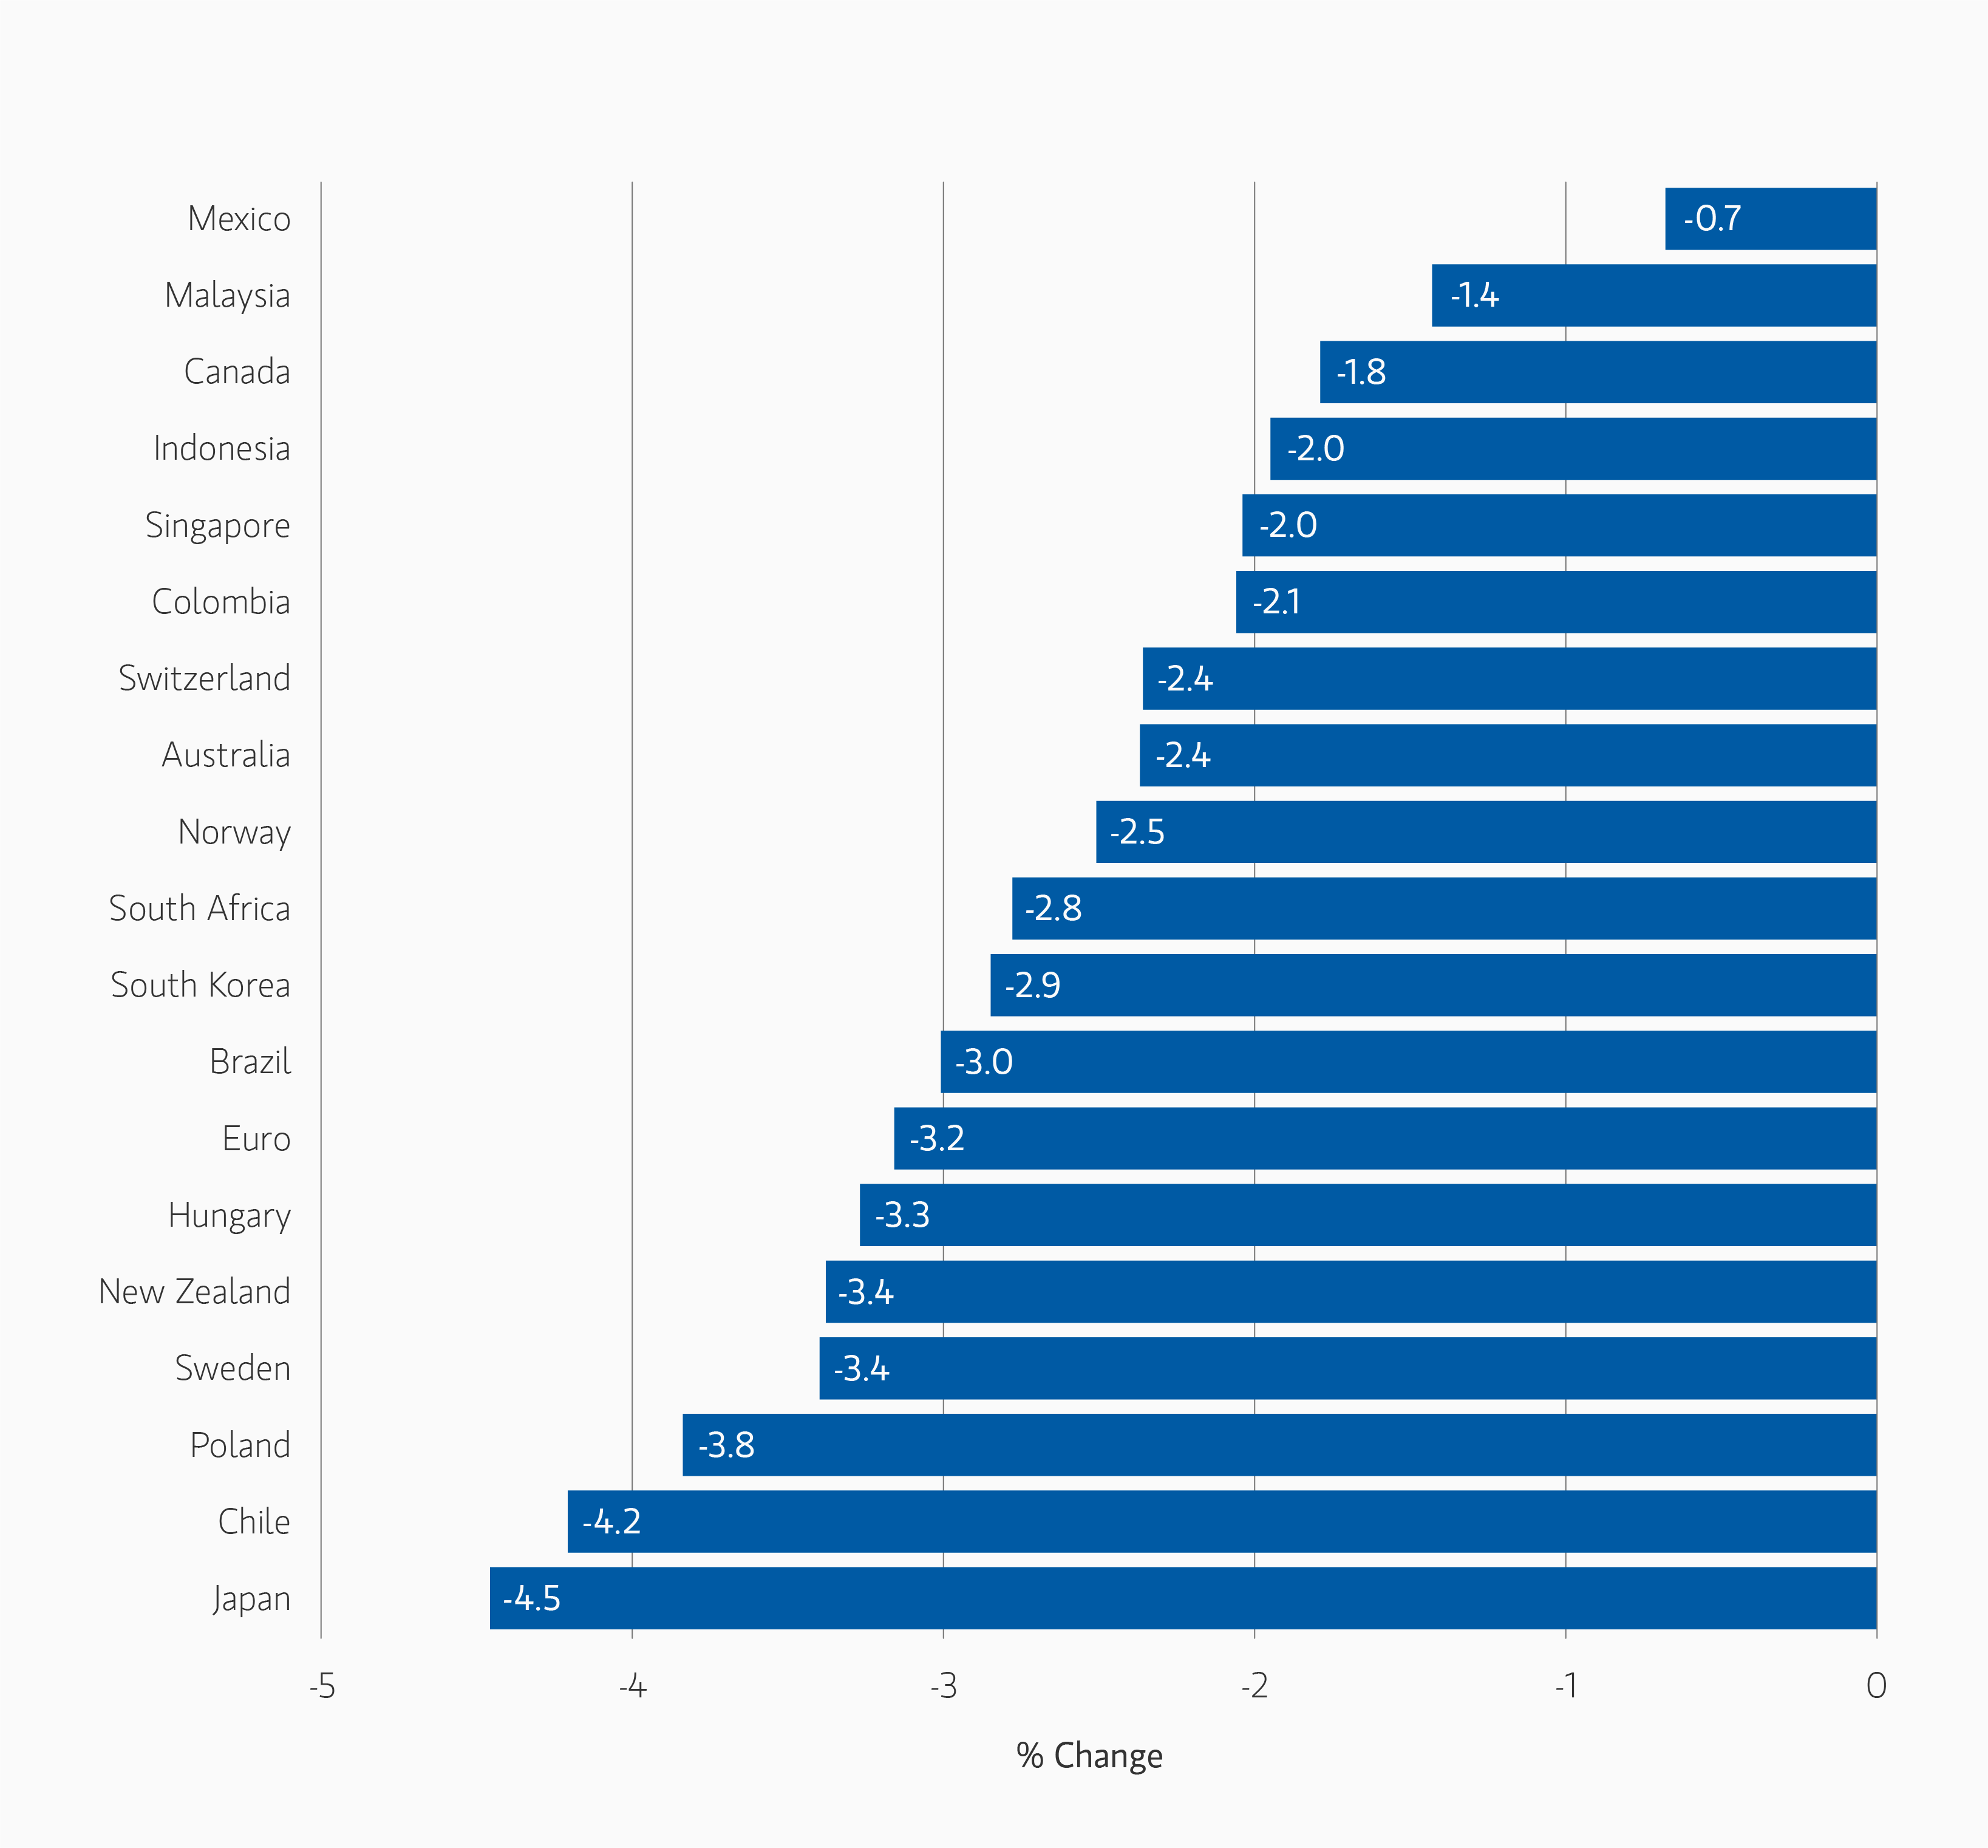
Currency Monthly Changes versus USD

DISPLAY 2
insights_if-we-knew-then-display_02.png

Note: Positive change means appreciation of the currency against the USD. Source: Bloomberg. Data as July 31, 2025.

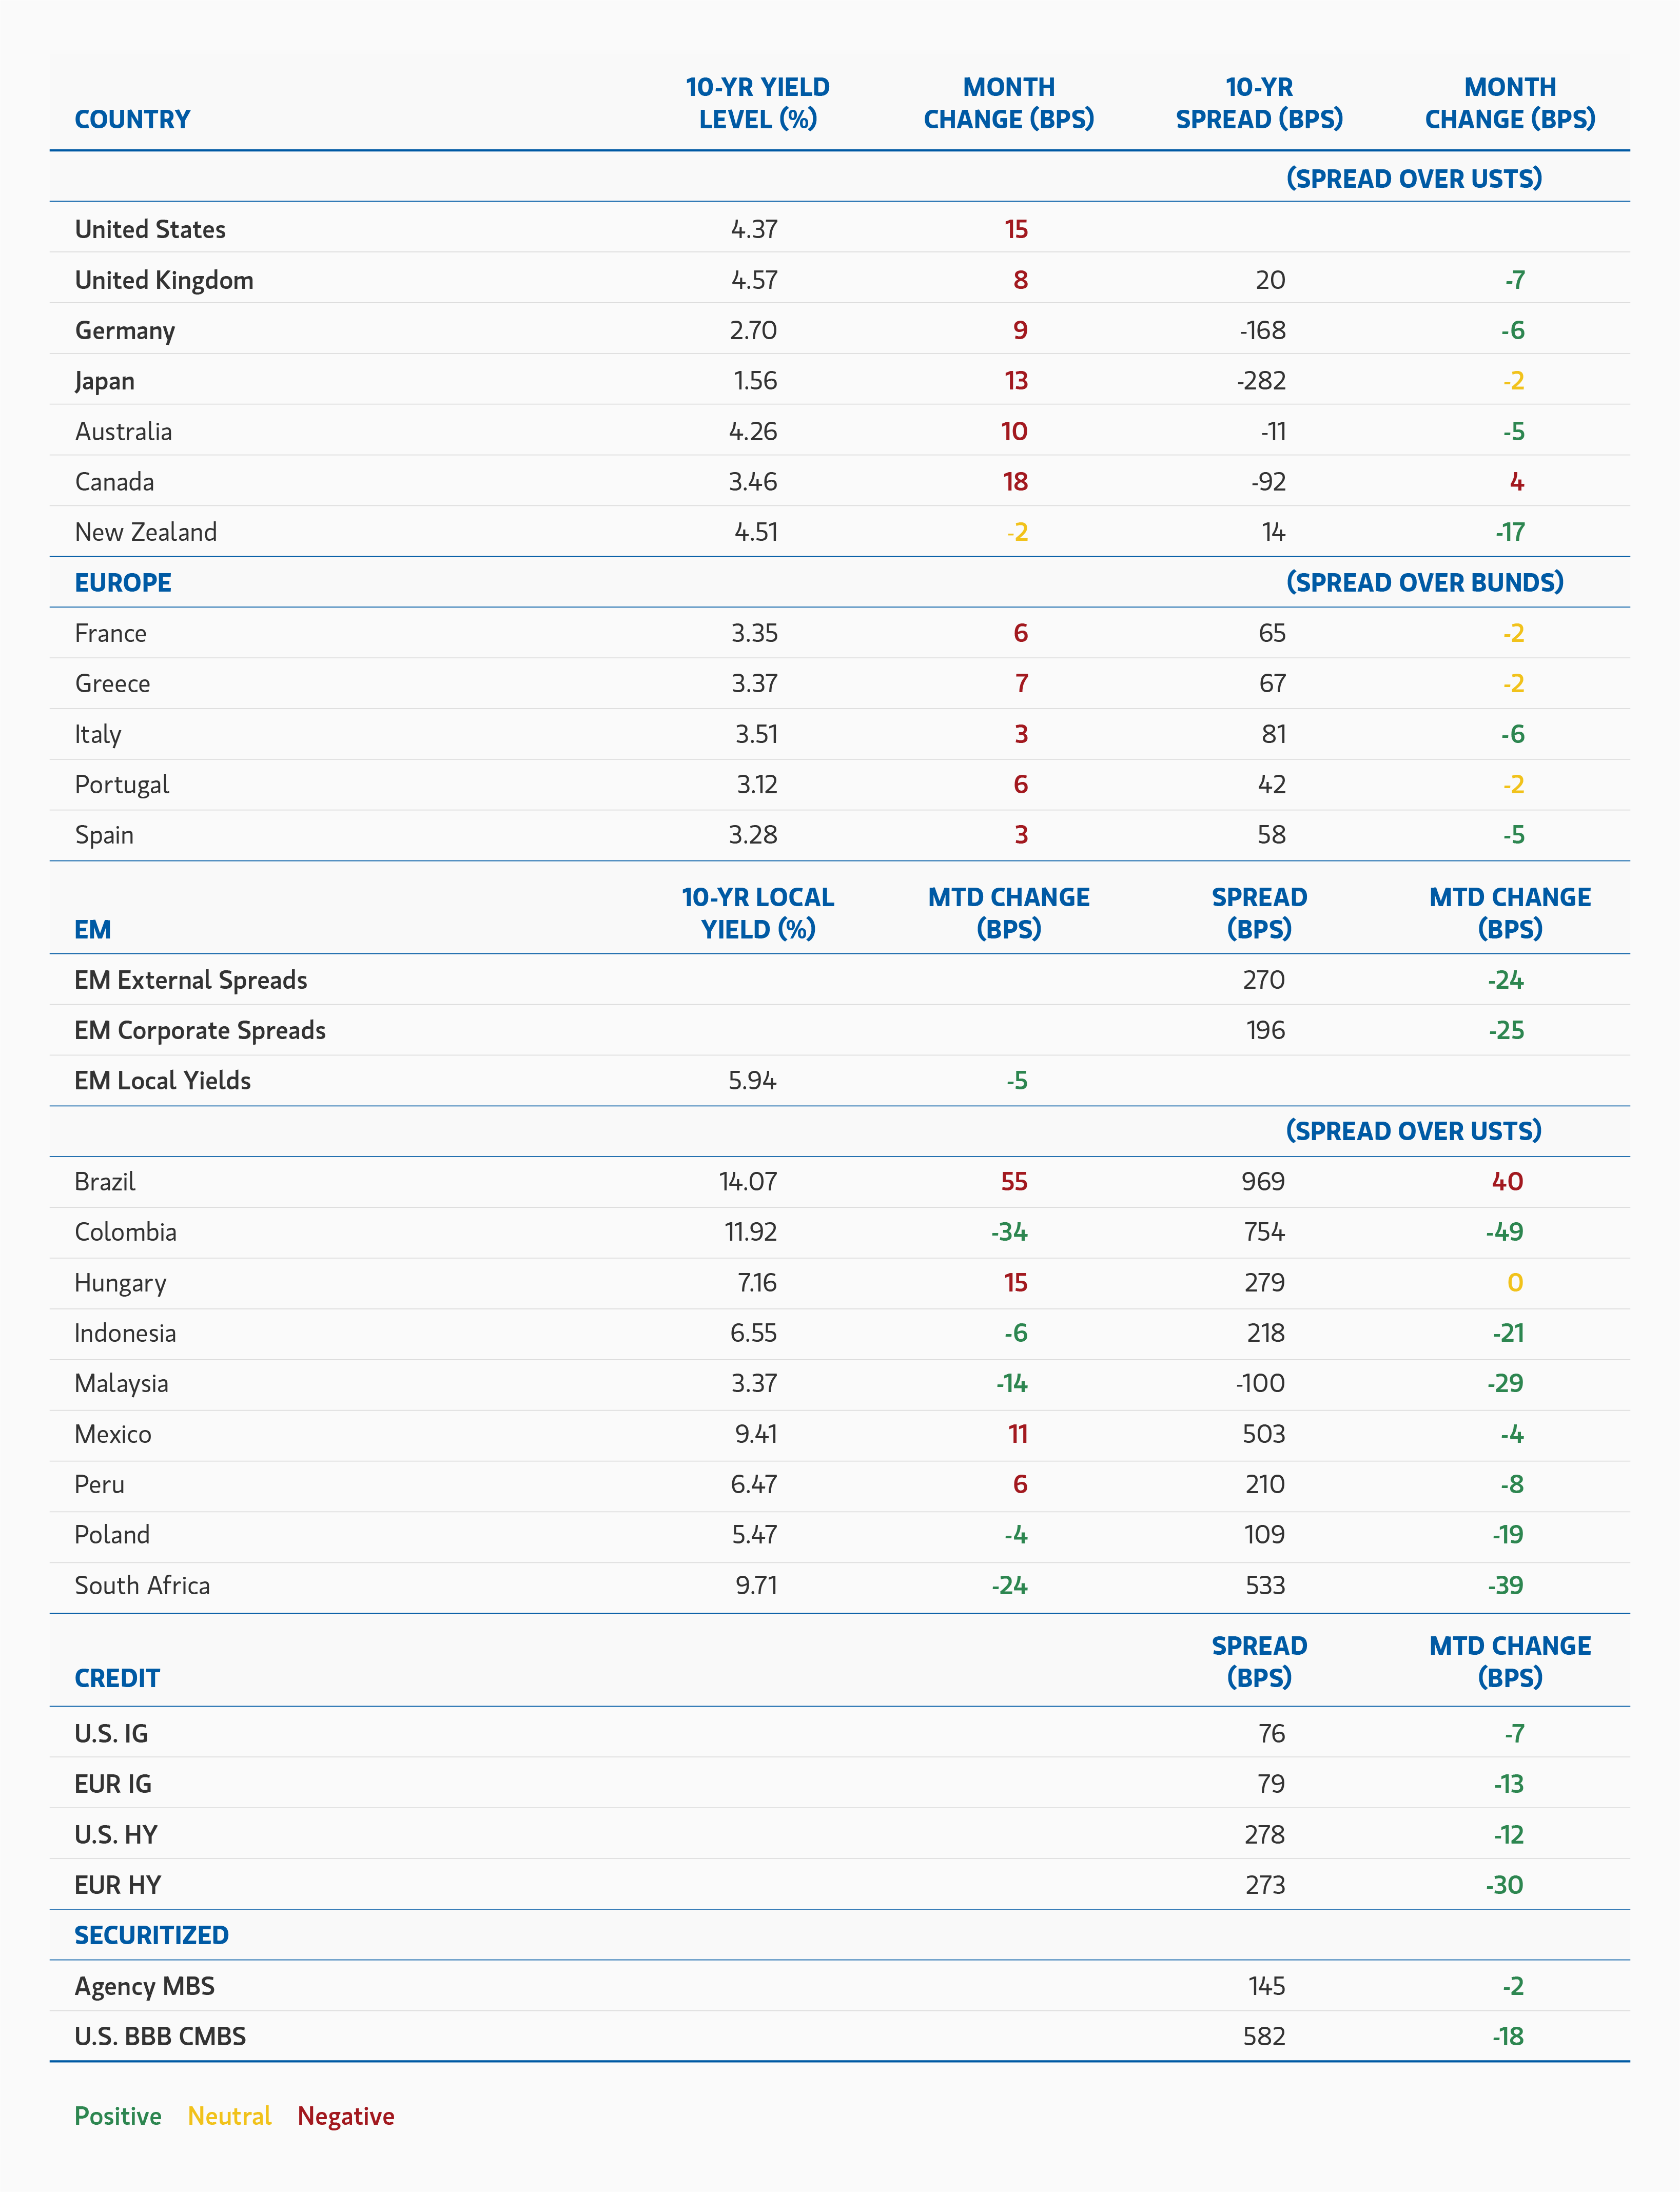
Major Monthly Changes in 10-Year Yields and Spreads

DISPLAY 3
insights_if-we-knew-then-display_03.png

Source: Bloomberg, JPMorgan. Data as of July 31, 2025.

Fixed Income Outlook

Fixed Income markets in July reflected investor sentiment that the U.S. economy had largely moved past the tariff-related uncertainty of the prior three months and was progressing at a steady—if unspectacular—pace. However, core inflation data releases for June (CPI and PCE) remained stubbornly sticky, showing a slight uptick from May.

Early in the month, the initial non-farm payrolls report for June exceeded expectations (147,000 vs. 106,000 forecast), reinforcing market confidence in the economy’s resilience. Yet subsequent revisions—amounting to a two-month downward adjustment of 258,000—revealed that labor market strength in May and June had been significantly overstated. At the time, though, traders interpreted the preliminary data as indicative of benign growth.

The Fed held rates steady as expected, but dissent from Governors Bowman and Waller—who cited labor market concerns and advocated for a rate cut—marked a notable shift. By month-end, 10-year Treasury yields had risen 15 bps. Fed Funds futures, which had priced in a 65% chance of up to three cuts by year-end at the end of June, revised expectations to just over a 30% chance of only two cuts by July 31.

As is typical for mid-summer, market activity was subdued and liquidity, thin. Credit spreads in both investment grade and high yield touched year-to-date lows. Securitized assets tightened, and the MOVE index—a measure of Treasury bond volatility—closed at its lowest level since January 2022, just before the Fed began its hiking cycle. With reduced expectations for Fed easing, the yield curve flattened, narrowing the 5-year vs. 30-year Treasury spread by 5 bps.

Other G10 rates markets largely mirrored U.S. moves. The ECB, Bank of Japan, Bank of Canada, and Reserve Bank of Australia all held rates steady, while the Bank of England did not meet. Ten-year yields rose across developed markets in sympathy with the U.S. Treasury move.

As the President’s self-imposed August 1 deadline for trade negotiations approached, the tariff structure became clearer. Deals struck after the initial post-Liberation Day pause suggest a 15% tariff baseline for trade agreements with the U.S., except for the UK, which agreed to 10%. The EU, Japan, and South Korea accepted 15% tariffs with no reciprocal duties on U.S. goods, alongside commitments for hundreds of billions in U.S. investment. India (25%), Switzerland (39%), and Brazil (50%) face higher rates. Canada remains in negotiations and currently faces a 35% tariff on non-USMCA-compliant goods, while Mexico received a 90-day extension to finalize its deal.

Additional tariffs on steel, aluminum, copper, and the removal of the WTO exemption on pharmaceuticals have pushed the average effective tariff rate on U.S. goods imports to 18.3%, up from 2.4% in January, according to the Budget Lab at Yale University. These tariffs are estimated to have raised U.S. consumer prices by 1.5%, accounting for substitution effects. As these deals were announced, Treasury TIPS breakevens—a key market gauge of inflation expectations—rose, with 5-year breakevens moving from 2.31% at the start of July to 2.48% by month-end.

We also gained clarity on another major Trump administration initiative: the One Big Beautiful Bill Act (OBBBA), signed into law on July 4. From a fixed income perspective, the primary concern is the likely expansion of the deficit from already elevated levels, despite a growing and fully employed economy. As previously noted, we expect these persistent deficits to exert upward pressure on real interest rates across the curve.

We’ve titled this monthly outlook “If We Knew Then What We Know Now” because July’s muted market movements were based on assumptions of steady economic growth. However, the August 1 employment report and significant downward revisions to prior payroll data suggest the picture may have been more fragile than it appeared. The months ahead promise to be revealing.


Developed Market Rate/Foreign Currency

Monthly Review

Developed market interest rates rose in the first half of July before retracing in the second half. Overall, bonds traded within a narrower range than in June, and 10-year U.S. Treasury yields ended the month 15 bps higher at 4.38%. The recent trend of curve steepening paused, as July’s data generally supported the Fed’s continued hawkish stance. June’s jobs report was strong, with the unemployment rate unexpectedly falling to 4.1%. Notably, the CPI report indicated price pressures in tariff-affected goods sectors, while other categories aligned with expectations.

President Trump’s initial trade negotiation window expired in early July, but the administration held off on re-imposing tariffs, extending the effective deadline to early August. Toward month-end, the U.S. announced trade agreements with key partners—including Japan, the EU, and Korea—featuring reduced tariff rates in exchange for FDI commitments and market access concessions. Talks with China were also underway. At the FOMC meeting, Fed Chair Powell’s press conference was more hawkish than anticipated, suggesting no urgency to cut rates given a balanced labor market.

Outside the U.S., other major markets experienced volatility. Gilts underperformed amid speculation that the Labour government might struggle to deliver welfare reforms and instead resort to growth-negative tax hikes. The ECB held rates steady at its July meeting but signaled that further easing would require a high threshold. Markets now price in approximately one more full cut for the remainder of the cycle. Inflation data met expectations, while PMIs pointed to some stabilization in the outlook. In Japan, expectations for further rate hikes resurfaced following the trade deal with Washington, though the Bank of Japan was more dovish than expected at its July policy meeting.

In foreign exchange markets, the dollar strengthened against peers, with the Bloomberg Dollar Index rising 2.6% over July. Exchange rates were particularly volatile in the second half of the month due to thinner liquidity and pressure on dollar-bearish positions, which were challenged by strong data and a hawkish Fed. The euro weakened notably after the trade deal confirmation, as did regional equities. The dollar-yen rate also crossed 150 following the Bank of Japan meeting.

Outlook

We have scaled back our duration longs in Developed Markets (DM) markets as economic data suggests no great urgency for rate cuts. We also retain our long-standing curve steepening exposures in U.S. Treasuries and Bunds, with a view that rising deficits and increased term premia can lead the long end of yield curves to underperform, even in the absence of aggressive rate cuts. In Japan, we remain underweight duration given a strong wage and inflation picture, which we think will lead to more hikes than the market currently prices. We also hold onto our inflation breakeven positions. We are short the U.S. dollar against a basket of currencies.


Emerging Market Rate/Foreign Currency

Monthly Review

Performance across Emerging Markets Debt was mixed in July. The U.S. dollar strengthened during the period, supported by strong economic data and reduced uncertainty as several countries finalized trade agreements with the U.S. Both sovereign and corporate credit spreads tightened month-over-month, bolstering hard currency index performance. Notable trade deals included agreements with the EU, Indonesia, and Japan. In negotiations with India, the U.S. raised the possibility of penalties due to India’s purchases of Russian oil. Meanwhile, the U.S. announced potential 50% tariffs on Brazil in connection with former President Jair Bolsonaro’s pending trial.

Tensions between Russia and Ukraine remained volatile, though the U.S. renewed military support for Ukraine and set a deadline for President Putin to agree to a ceasefire. Asset class flows were positive for both local and hard currency funds for the third consecutive month. Following record annual outflows from 2022 to 2024, the asset class returned to net inflows in June.

Outlook

Valuations for emerging markets debt continue to look attractive, specifically for currencies and local interest rates. EM currencies continue to be supported by improving country level fundamentals and policy measures in the U.S. that are putting downward pressure on the U.S. dollar. Real yield differentials between emerging and developed markets are quite wide and will likely further benefit if EM central banks continue to cut rates. As countries continue to make trade agreements a level of uncertainty will likely be reduced in the macro economy. While tariffs may not be as severe and sweeping as initially announced in April, many countries are still likely to be hit with elevated tariff level and this will likely have disinflationary impacts. The International Monetary Fund slightly raised its global growth expectations citing a drop in the effective U.S. tariff rate, but the global economy does still face many potential economic headwinds due to continued trade negotiations and ongoing wars. Focusing on bottom-up country level fundamentals remains critical due to the differentiated nature of the asset class.


Corporate Credit

Monthly Review

Risk assets advanced modestly in July, supported by announced tariff agreements with the EU and Japan, easing concerns over Fed independence, and resilient corporate earnings. EUR IG outperformed U.S. IG, driven by lighter supply and strong technicals. The month featured a series of trade agreements, including U.S. deals with Japan and the EU that reduced auto tariffs, expanded market access, and unlocked over $1.9 trillion in investment pledges. President Trump also signaled progress with China and increased pressure on pharmaceutical firms regarding pricing. Central banks held policy steady. The ECB maintained optionality, while the Fed showed internal division for the first time since 1993. Economic data pointed to modest improvement: Eurozone PMIs and U.S. retail sales surprised to the upside, and Q2 GDP reflected normalization following earlier frontloading. Inflation remained sticky but stable, with Euro area Harmonised Index of Consumer Prices holding at 2.0% and U.S. core CPI showing pressure in tariff-sensitive categories. Corporate earnings were broadly resilient, led by banks and non-cyclicals, though autos and chemicals showed softness. M&A activity picked up across sectors. Technicals remained strong, with record July issuance of €31 billion—driven by financials—and continued robust inflows into IG credit.

In the U.S. and global high yield markets, performance moderated. The U.S. made mixed progress in trade negotiations, Q2 GDP growth exceeded expectations, and early corporate earnings showed continued resilience. Capital market activity accelerated, with U.S. high yield recording its busiest month of gross issuance this year. The leveraged loan market also saw a surge in repricing activity. Lower-quality segments generally outperformed amid strong risk appetite and a 17-basis point rise in 5-year Treasury yields, which weighed on higher-quality BB-rated bonds1.

Global convertible bonds performed well alongside other risk assets. Despite mixed progress in U.S. trade negotiations, Q2 earnings remained resilient. Global convertibles outperformed both global equities and bonds. The primary market was strong for a typically quiet month, with $11.4 billion in issuance—the highest July total since 2007 and 2.5 times the historical average. Issuance was led by the U.S., with solid contributions from Asia and Japan, though Europe saw no new deals. Year-to-date supply reached $82 billion, up 18% from the same period in 2024.2  

Outlook

We remain cautiously constructive on credit, expecting low growth without a significant rise in downgrade or default risk. European policy remains supportive, while the U.S. fiscal outlook is more mixed. Corporate fundamentals are solid, with firms maintaining low-risk strategies. Technicals are favorable, supported by manageable issuance and strong demand for IG yields. While carry is expected to remain a key driver of returns, we are mindful of the current extreme tightness in credit spreads. As the full impact of newly announced trade policies has yet to materialize, we remain selective in our credit exposures—favoring issuers with strong fundamentals, lower cyclicality, and positioning to benefit from a moderate growth environment. The growth outlook remains uncertain as we await the effects of higher global tariff rates. Given this backdrop, we have limited confidence in material spread tightening.

We remain cautious on high yield credit heading into the third quarter. While peak risk and volatility from evolving trade policy may be behind us, the final framework of international trade with key partners remains unclear. We expect the evolving trade landscape to continue weighing on growth and contributing to inflationary pressures. Yields remain historically attractive, but high yield spreads are tight and vulnerable to widening. Our cautious stance reflects a comprehensive analysis of U.S. and global growth, central bank policy, consumer health, issuer fundamentals, technicals, and valuations. While we view recession risk this year as low, we anticipate further bouts of volatility.

We continue to be constructive on the fundamentals of the global convertible bond market. Convertibles maintain their asymmetric profiles, with balanced deltas and strong bond floors. While trade-related volatility may have peaked, the long-term structure of global trade remains uncertain. Tensions in the Middle East have eased, but the durability of the ceasefire remains to be seen. The bond floor feature will be especially valuable if volatility resurfaces, as seen in Q2. Despite our constructive view on fundamentals, we are cautious on the primary market, which is on pace to exceed 2024’s totals. Most issuers are refinancing maturing debt in a high-rate environment, but the growing trend of crypto-linked issuance—where companies issue debt to buy cryptocurrency—warrants caution. That said, it also presents opportunities for well-resourced investment teams focused on bottom-up fundamental research.


Securitized Products

Monthly Review

Agency MBS spreads continued their gradual tightening, narrowing by 2 bps to +145 bps over comparable-duration Treasuries. Despite this move, spreads remain historically wide and relatively cheap versus other core fixed income sectors. The Fed reduced its MBS holdings by $19 billion to $2.120 trillion, marking a $583 billion decline from its 2022 peak. Bank holdings were unchanged at $2.683 trillion, though expectations for increased demand are rising with potential SLR easing and lower short-term rates.3 Money managers remain the dominant buyers, attracted by favorable valuations. The Agency MBS Index returned -0.41% in July, matching Treasury performance on a duration-adjusted basis, but still lagging YTD by 62 bps. The current yield rose to 5.18%, while 30-year mortgage rates fell to 6.72%, keeping most outstanding mortgages out-of-the-money for refinancing.

Securitized Credit sectors saw modest spread tightening, underperforming corporates due to less aggressive spread compression. Issuance remained robust and well-absorbed: ABS issuance reached $41.12 billion, CMBS $13.3 billion (up 45% YoY), and RMBS $13.6 billion (down 17% from June).4 Non-agency RMBS spreads tightened 5-10 bps, supported by strong mortgage fundamentals—low delinquencies, high homeowner equity, and stable home prices despite limited supply and elevated rates. ABS spreads also tightened 5-10 bps, though rising consumer credit delinquencies—especially among lower-income borrowers—pose a growing concern. CMBS spreads followed suit, with strength in high-end apartments, logistics, and luxury hotels, while Class B office properties remain challenged. Tariff impacts on hotels and retail assets are being closely monitored.

Outlook

We anticipate continued tightening in U.S. Agency MBS spreads, driven by inflows from relative value investors and banks seeking attractive return profiles compared to other core fixed income sectors and cash alternatives. However, we expect this tightening to materialize more meaningfully once the Federal Reserve initiates rate cuts, likely in the final quarter of the year. Agency MBS valuations remain compelling, both versus investment-grade corporates and historical averages, positioning the sector well for future performance.

Securitized credit spreads are expected to remain range-bound in the near term, pending greater clarity on the economic implications of evolving tariff policies and further spread compression in Agency MBS. While Agency MBS has underperformed corporates year-to-date, securitized credit has outperformed most investment-grade sectors due to its higher carry. We expect returns to be driven primarily by cashflow carry, supported by attractive yields entering August. Nonetheless, elevated rate levels continue to pressure household balance sheets, particularly impacting consumer ABS tied to lower-income borrowers. Commercial real estate also faces headwinds from current financing costs.

Our highest conviction remains in residential mortgage credit, where strong fundamentals—such as low delinquency rates, high homeowner equity, and stable employment—support performance. This is the one area where we are comfortable extending down the credit spectrum. In contrast, we remain cautious on lower-rated ABS and CMBS, where credit stress is more likely to emerge. Overall, we maintain a constructive view on Agency MBS and select securitized credit sectors, with a focus on carry and credit quality as key drivers of performance in the months ahead.


1 Source: MSIM, ICE Indices, Bloomberg L.P., July 31, 2025

2 Source: Bank of America, July 31, 2025

3 Source: Bloomberg, as of July 31, 2025

4 Source: Bloomberg, as of July 31, 2025


RISK CONSIDERATIONS

Diversification neither assures a profit nor guarantees against loss in a declining market.

There is no assurance that a portfolio will achieve its investment objective. Portfolios are subject to market risk, which is the possibility that the market values of securities owned by the portfolio will decline and that the value of portfolio shares may therefore be less than what you paid for them. Market values can change daily due to economic and other events (e.g., natural disasters, health crises, terrorism, conflicts, and social unrest) that affect markets, countries, companies, or governments. It is difficult to predict the timing, duration, and potential adverse effects (e.g., portfolio liquidity) of events. Accordingly, you can lose money investing in a portfolio. Fixed-income securities are subject to the ability of an issuer to make timely principal and interest payments (credit risk), changes in interest rates (interest rate risk), the creditworthiness of the issuer and general market liquidity (market risk). In a rising interest-rate environment, bond prices may fall and may result in periods of volatility and increased portfolio redemptions. In a declining interest-rate environment, the portfolio may generate less income. Longer-term securities may be more sensitive to interest rate changes. Certain U.S. government securities purchased by the strategy, such as those issued by Fannie Mae and Freddie Mac, are not backed by the full faith and credit of the U.S. It is possible that these issuers will not have the funds to meet their payment obligations in the future. Public bank loans are subject to liquidity risk and the credit risks of lower-rated securities. High-yield securities (junk bonds) are lower-rated securities that may have a higher degree of credit and liquidity risk. Sovereign debt securities are subject to default risk. Mortgage- and asset-backed securities are sensitive to early prepayment risk and a higher risk of default and may be hard to value and difficult to sell (liquidity risk). They are also subject to credit, market, and interest rate risks. The currency market is highly volatile. Prices in these markets are influenced by, among other things, changing supply and demand for a particular currency; trade; fiscal, money and domestic or foreign exchange control programs and policies; and changes in domestic and foreign interest rates. Investments in foreign markets entail special risks such as currency, political, economic and market risks. The risks of investing in emerging market countries are greater than the risks generally associated with foreign investments. Derivative instruments may disproportionately increase losses and have a significant impact on performance. They also may be subject to counterparty, liquidity, valuation, and correlation and market risks. Restricted and illiquid securities may be more difficult to sell and value than publicly traded securities (liquidity risk). Due to the possibility that prepayments will alter the cash flows on collateralized mortgage obligations (CMOs), it is not possible to determine in advance their final maturity date or average life. In addition, if the collateral securing the CMOs or any third-party guarantees are insufficient to make payments, the portfolio could sustain a loss.


DEFINITIONS

Basis point (bp): One basis point = 0.01%.


INDEX DEFINITIONS

The indexes shown in this report are not meant to depict the performance of any specific investment, and the indexes shown do not include any expenses, fees, or sales charges, which would lower performance. The indexes shown are unmanaged and should not be considered an investment. It is not possible to invest directly in an index.

“Bloomberg®” and the Bloomberg Index/Indices used are service marks of Bloomberg Finance L.P. and its affiliates and have been licensed for use for certain purposes by Morgan Stanley Investment Management (MSIM). Bloomberg is not affiliated with MSIM, does not approve, endorse, review, or recommend any product, and. does not guarantee the timeliness, accurateness, or completeness of any data or information relating to any product.

The Bloomberg Euro Aggregate Corporate Index (Bloomberg Euro IG Corporate) is an index designed to reflect the performance of the euro-denominated investment-grade corporate bond market.

The Bloomberg Global Aggregate Corporate Index is the corporate component of the Bloomberg Global Aggregate index, which provides a broad-based measure of the global investment-grade fixed income markets.

The Bloomberg US Corporate High Yield Index measures the market of USD-denominated, non-investment grade, fixed-rate, taxable corporate bonds. Securities are classified as high yield if the middle rating of Moody’s, Fitch, and S&P is Ba1/BB+/BB+ or below. The index excludes emerging market debt.

The Bloomberg US Corporate Index is a broad-based benchmark that measures the investment grade, fixed-rate, taxable, corporate bond market.

The Bloomberg US Mortgage-Backed Securities (MBS) Index tracks agency mortgage-backed pass-through securities (both fixed-rate and hybrid ARM) guaranteed by Ginnie Mae (GNMA), Fannie Mae (FNMA) and Freddie Mac (FHLMC). The index is constructed by grouping individual TBA-deliverable MBS pools into aggregates or generics based on program, coupon, and vintage. Introduced in 1985, the GNMA, FHLMC and FNMA fixed-rate indexes for 30- and 15-year securities were backdated to January 1976, May 1977, and November 1982, respectively. In April 2007, agency hybrid adjustable-rate mortgage (ARM) pass-through securities were added to the index.

Consumer Price Index (CPI) is a measure that examines the weighted average of prices of a basket of consumer goods and services, such as transportation, food, and medical care.

Euro vs. USD—Euro total return versus U.S. dollar.

German 10YR bonds—Germany Benchmark 10-Year Datastream Government Index; Japan 10YR government bonds —Japan Benchmark 10-Year Datastream Government Index; and 10YR US Treasury—US Benchmark 10-Year Datastream Government Index.

The ICE BofAML European Currency High-Yield Constrained Index (ICE BofAML Euro HY constrained) is designed to track the performance of euro- and British pound sterling-denominated below investment-grade corporate debt publicly issued in the Eurobond, sterling.

The ICE BofAML US Mortgage-Backed Securities (ICE BofAML US Mortgage Master) Index tracks the performance of US dollar-denominated, fixed-rate and hybrid residential mortgage pass-through securities publicly issued by US agencies in the US domestic market.

The ICE BofAML US High Yield Master II Constrained Index (ICE BofAML US High Yield) is a market value-weighted index of all domestic and Yankee high-yield bonds, including deferred-interest bonds and payment-in-kind securities. Its securities have maturities of one year or more and a credit rating lower than BBB-/Baa3 but are not in default.

The ISM Manufacturing Index is based on surveys of more than 300 manufacturing firms by the Institute of Supply Management. The ISM Manufacturing Index monitors employment, production inventories, new orders, and supplier deliveries. A composite diffusion index is created that monitors conditions in national manufacturing based on the data from these surveys.

Italy 10-Year Government Bonds—Italy Benchmark 10-Year Datastream Government Index.

The JP Morgan CEMBI Broad Diversified Index is a global, liquid corporate emerging markets benchmark that tracks US-denominated corporate bonds issued by emerging markets entities.

The JPMorgan Government Bond Index—emerging markets (JPM local EM debt) tracks local currency bonds issued by emerging market governments. The index is positioned as the investable benchmark that includes only those countries that are accessible by most of the international investor base (excludes China and India as of September 2013).

The JPMorgan Government Bond Index Emerging Markets (JPM External EM Debt) tracks local currency bonds issued by emerging market governments. The index is positioned as the investable benchmark that includes only those countries that are accessible by most of the international investor base (excludes China and India as of September 2013).

The JP Morgan Emerging Markets Bond Index Global (EMBI Global) tracks total returns for traded external debt instruments in the emerging markets and is an expanded version of the EMBI+. As with the EMBI+, the EMBI Global includes US dollar-denominated Brady bonds, loans, and Eurobonds with an outstanding face value of at least $500 million.

The JP Morgan GBI-EM Global Diversified Index is a market-capitalization weighted, liquid global benchmark for US-dollar corporate emerging market bonds representing Asia, Latin America, Europe, and the Middle East/Africa.

JPY vs. USD—Japanese yen total return versus US dollar.

The Markit ITraxx Europe Index comprises 125 equally weighted credit default swaps on investment grade European corporate entities, distributed among 4 sub-indices: Financials (Senior & Subordinated), Non-Financials and HiVol.

The Nikkei 225 Index (Japan Nikkei 225) is a price-weighted index of Japan’s top 225 blue-chip companies on the Tokyo Stock Exchange.

The MSCI AC Asia ex-Japan Index (MSCI Asia ex-Japan) captures large- and mid-cap representation across two of three developed markets countries (excluding Japan) and eight emerging markets countries in Asia.

The MSCI All Country World Index (ACWI, MSCI global equities) is a free float-adjusted market capitalization weighted index designed to measure the equity market performance of developed and emerging markets. The term "free float" represents the portion of shares outstanding that are deemed to be available for purchase in the public equity markets by investors. The performance of the Index is listed in US dollars and assumes reinvestment of net dividends.

MSCI Emerging Markets Index (MSCI emerging equities) captures large- and mid-cap representation across 23 emerging markets (EM) countries.

The MSCI World Index (MSCI developed equities) captures large and mid-cap representation across 23 developed market (DM) countries.

Purchasing Managers Index (PMI) is an indicator of the economic health of the manufacturing sector.

The Refinitiv Convertible Global Focus USD Hedged Index is a market weighted index with a minimum size for inclusion of $500 million (US), 200 million (Europe), 22 billion Yen, and $275 million (Other) of Convertible Bonds with an Equity Link.

The Russell 2000® Index is an index that measures the performance of the 2,000 smallest companies in the Russell 3000 Index.

The S&P 500® Index (US S&P 500) measures the performance of the large-cap segment of the US equities market, covering approximately 75 percent of the US equities market. The index includes 500 leading companies in leading industries of the U.S. economy.

S&P CoreLogic Case-Shiller US National Home Price NSA Index seeks to measure the value of residential real estate in 20 major US metropolitan areas: Atlanta, Boston, Charlotte, Chicago, Cleveland, Dallas, Denver, Detroit, Las Vegas, Los Angeles, Miami, Minneapolis, New York, Phoenix, Portland, San Diego, San Francisco, Seattle, Tampa and Washington, D.C.

The S&P/LSTA US Leveraged Loan 100 Index (S&P/LSTA Leveraged Loan Index) is designed to reflect the performance of the largest facilities in the leveraged loan market.

The S&P GSCI Copper Index (Copper), a sub-index of the S&P GSCI, provides investors with a reliable and publicly available benchmark for investment performance in the copper commodity market.

The S&P GSCI Softs (GSCI soft commodities) Index is a sub-index of the S&P GSCI that measures the performance of only the soft commodities, weighted on a world production basis. In 2012, the S&P GSCI Softs Index included the following commodities: coffee, sugar, cocoa, and cotton.

Spain 10-Year Government Bonds—Spain Benchmark 10-Year Datastream Government Index.

The Thomson Reuters Convertible Global Focus USD Hedged Index is a market weighted index with a minimum size for inclusion of $500 million (US), 200 million euro (Europe), 22 billion yen, and $275 million (Other) of convertible bonds with an equity link.

U.K. 10YR government bonds—U.K. Benchmark 10-Year Datastream Government Index. For the following Datastream government bond indexes, benchmark indexes are based on single bonds. The bond chosen for each series is the most representative bond available for the given maturity band at each point in time. Benchmarks are selected according to the accepted conventions within each market. Generally, the benchmark bond is the latest issue within the given maturity band; consideration is also given to yield, liquidity, issue size and coupon.

The US Dollar Index (DXY) is an index of the value of the United States dollar relative to a basket of foreign currencies, often referred to as a basket of US trade partners’ currencies.

The Chicago Board Options Exchange (CBOE) Market Volatility (VIX) Index shows the market’s expectation of 30-day volatility.

There is no guarantee that any investment strategy will work under all market conditions, and each investor should evaluate their ability to invest for the long-term, especially during periods of downturn in the market.

A separately managed account may not be appropriate for all investors. Separate accounts managed according to the particular strategy may include securities that may not necessarily track the performance of a particular index. Please consider the investment objectives, risks and fees of the Strategy carefully before investing. A minimum asset level is required. For important information about the investment managers, please refer to Form ADV Part 2.

The views and opinions and/or analysis expressed are those of the author or the investment team as of the date of preparation of this material and are subject to change at any time without notice due to market or economic conditions and may not necessarily come to pass. Furthermore, the views will not be updated or otherwise revised to reflect information that subsequently becomes available or circumstances existing, or changes occurring, after the date of publication. The views expressed do not reflect the opinions of all investment personnel at Morgan Stanley Investment Management (MSIM) and its subsidiaries and affiliates (collectively “the Firm”) and may not be reflected in all the strategies and products that the Firm offers.

Forecasts and/or estimates provided herein are subject to change and may not actually come to pass. Information regarding expected market returns and market outlooks is based on the research, analysis and opinions of the authors or the investment team. These conclusions are speculative in nature, may not come to pass and are not intended to predict the future performance of any specific strategy or product the Firm offers. Future results may differ significantly depending on factors such as changes in securities or financial markets or general economic conditions.

This material has been prepared on the basis of publicly available information, internally developed data and other third-party sources believed to be reliable. However, no assurances are provided regarding the reliability of such information and the Firm has not sought to independently verify information taken from public and third-party sources.

This material is a general communication, which is not impartial, and all information provided has been prepared solely for informational and educational purposes and does not constitute an offer or a recommendation to buy or sell any particular security or to adopt any specific investment strategy. The information herein has not been based on a consideration of any individual investor circumstances and is not investment advice, nor should it be construed in any way as tax, accounting, legal or regulatory advice. To that end, investors should seek independent legal and financial advice, including advice as to tax consequences, before making any investment decision.

Charts and graphs provided herein are for illustrative purposes only. Past performance is no guarantee of future results.

The indexes are unmanaged and do not include any expenses, fees, or sales charges. It is not possible to invest directly in an index. Any index referred to herein is the intellectual property (including registered trademarks) of the applicable licensor. Any product based on an index is in no way sponsored, endorsed, sold, or promoted by the applicable licensor and it shall not have any liability with respect thereto.

This material is not a product of Morgan Stanley’s Research Department and should not be regarded as a research material or a recommendation.

The Firm has not authorized financial intermediaries to use and to distribute this material unless such use and distribution is made in accordance with applicable law and regulation. Additionally, financial intermediaries are required to satisfy themselves that the information in this material is appropriate for any person to whom they provide this material in view of that person’s circumstances and purpose. The Firm shall not be liable for, and accepts no liability for, the use or misuse of this material by any such financial intermediary.

This material may be translated into other languages. Where such a translation is made this English version remains definitive. If there are any discrepancies between the English version and any version of this material in another language, the English version shall prevail.

The whole or any part of this material may not be directly or indirectly reproduced, copied, modified, used to create a derivative work, performed, displayed, published, posted, licensed, framed, distributed, or transmitted or any of its contents disclosed to third parties without the Firm’s express written consent. This material may not be linked to unless such hyperlink is for personal and non-commercial use. All information contained herein is proprietary and is protected under copyright and other applicable law.

Eaton Vance is part of Morgan Stanley Investment Management. Morgan Stanley Investment Management is the asset management division of Morgan Stanley.


DISTRIBUTION

This material is only intended for and will only be distributed to persons resident in jurisdictions where such distribution or availability would not be contrary to local laws or regulations.

MSIM, the asset management division of Morgan Stanley (NYSE: MS), and its affiliates have arrangements in place to market each other’s products and services. Each MSIM affiliate is regulated as appropriate in the jurisdiction it operates. MSIM’s affiliates are: Eaton Vance Management (International) Limited, Eaton Vance Advisers International Ltd, Calvert Research and Management, Eaton Vance Management, Parametric Portfolio Associates LLC, and Atlanta Capital Management LLC.

This material has been issued by any one or more of the following entities:


EMEA:

This material is for Professional Clients/Accredited Investors only.

In the EU, MSIM and Eaton Vance materials are issued by MSIM Fund Management (Ireland) Limited (“FMIL”). FMIL is regulated by the Central Bank of Ireland and is incorporated in Ireland as a private company limited by shares with company registration number 616661 and has its registered address at 24-26 City Quay, Dublin 2, D02 NY 19, Ireland.

Outside the EU, MSIM materials are issued by Morgan Stanley Investment Management Limited (MSIM Ltd) is authorised and regulated by the Financial Conduct Authority. Registered in England. Registered No. 1981121. Registered Office: 25 Cabot Square, Canary Wharf, London E14 4QA.

In Switzerland, MSIM materials are issued by Morgan Stanley & Co. International plc, London (Zurich Branch) Authorised and regulated by the Eidgenössische Finanzmarktaufsicht ("FINMA"). Registered Office: Beethovenstrasse 33, 8002 Zurich, Switzerland.

Outside the US and EU, Eaton Vance materials are issued by Eaton Vance Management (International) Limited (“EVMI”) 125 Old Broad Street, London, EC2N 1AR, UK, which is authorised and regulated in the United Kingdom by the Financial Conduct Authority.

Italy: MSIM FMIL (Milan Branch), (Sede Secondaria di Milano) Palazzo Serbelloni Corso Venezia, 16 20121 Milano, Italy. The Netherlands: MSIM FMIL (Amsterdam Branch), Rembrandt Tower, 11th Floor Amstelplein 1 1096HA, Netherlands. France: MSIM FMIL (Paris Branch), 61 rue de Monceau 75008 Paris, France. Spain: MSIM FMIL (Madrid Branch), Calle Serrano 55, 28006, Madrid, Spain. Germany: Germany: MSIM FMIL (Frankfurt Branch), Grosse Gallusstrasse 18, 60312 Frankfurt am Main, Germany (Gattung: Zweigniederlassung (FDI) gem. § 53b KWG). Denmark: MSIM FMIL (Copenhagen Branch), Gorrissen Federspiel, Axel Towers, Axeltorv2, 1609 Copenhagen V, Denmark.


MIDDLE EAST

Dubai: MSIM Ltd (Representative Office, Unit Precinct 3-7th Floor-Unit 701 and 702, Level 7, Gate Precinct Building 3, Dubai International Financial Centre, Dubai, 506501, United Arab Emirates. Telephone: +97 (0)14 709 7158). This document is distributed in the Dubai International Financial Centre by Morgan Stanley Investment Management Limited (Representative Office), an entity regulated by the Dubai Financial Services Authority (“DFSA”). It is intended for use by professional clients and market counterparties only. This document is not intended for distribution to retail clients, and retail clients should not act upon the information contained in this document.

This document relates to a financial product which is not subject to any form of regulation or approval by the DFSA. The DFSA has no responsibility for reviewing or verifying any documents in connection with this financial product. Accordingly, the DFSA has not approved this document or any other associated documents nor taken any steps to verify the information set out in this document and has no responsibility for it. The financial product to which this document relates may be illiquid and/or subject to restrictions on its resale or transfer. Prospective purchasers should conduct their own due diligence on the financial product. If you do not understand the contents of this document, you should consult an authorized financial adviser.


US

NOT FDIC INSURED | OFFER NO BANK GUARANTEE | MAY LOSE VALUE | NOT INSURED BY ANY FEDERAL GOVERNMENT AGENCY | NOT A DEPOSIT

Latin America (Brazil, Chile Colombia, Mexico, Peru, and Uruguay)

This material is for use with an institutional investor or a qualified investor only. All information contained herein is confidential and is for the exclusive use and review of the intended addressee and may not be passed on to any third party. This material is provided for informational purposes only and does not constitute a public offering, solicitation, or recommendation to buy or sell for any product, service, security and/or strategy. A decision to invest should only be made after reading the strategy documentation and conducting in-depth and independent due diligence.


ASIA PACIFIC

Hong Kong: This material is disseminated by Morgan Stanley Asia Limited for use in Hong Kong and shall only be made available to “professional investors” as defined under the Securities and Futures Ordinance of Hong Kong (Cap 571). The contents of this material have not been reviewed nor approved by any regulatory authority including the Securities and Futures Commission in Hong Kong. Accordingly, save where an exemption is available under the relevant law, this material shall not be issued, circulated, distributed, directed at, or made available to, the public in Hong Kong. Singapore: This material is disseminated by Morgan Stanley Investment Management Company and may not be circulated or distributed, whether directly or indirectly, to persons in Singapore other than to (i) an accredited investor (ii) an expert investor or (iii) an institutional investor as defined in Section 4A of the Securities and Futures Act, Chapter 289 of Singapore (“SFA”); or (iv) otherwise pursuant to, and in accordance with the conditions of, any other applicable provision of the SFA. This publication has not been reviewed by the Monetary Authority of Singapore. Australia: This material is provided by Morgan Stanley Investment Management (Australia) Pty Ltd ABN 22122040037, AFSL No. 314182 and its affiliates and does not constitute an offer of interests. Morgan Stanley Investment Management (Australia) Pty Limited arranges for MSIM affiliates to provide financial services to Australian wholesale clients. Interests will only be offered in circumstances under which no disclosure is required under the Corporations Act 2001 (Cth) (the “Corporations Act”). Any offer of interests will not purport to be an offer of interests in circumstances under which disclosure is required under the Corporations Act and will only be made to persons who qualify as a “wholesale client” (as defined in the Corporations Act). This material will not be lodged with the Australian Securities and Investments Commission.


Japan:

For professional investors, this document is circulated or distributed for informational purposes only. For those who are not professional investors, this document is provided in relation to Morgan Stanley Investment Management (Japan) Co., Ltd. (“MSIMJ”)’s business with respect to discretionary investment management agreements (“IMA”) and investment advisory agreements (“IAA”). This is not for the purpose of a recommendation or solicitation of transactions or offers any particular financial instruments. Under an IMA, with respect to management of assets of a client, the client prescribes basic management policies in advance and commissions MSIMJ to make all investment decisions based on an analysis of the value, etc. of the securities, and MSIMJ accepts such commission. The client shall delegate to MSIMJ the authorities necessary for making investment. MSIMJ exercises the delegated authorities based on investment decisions of MSIMJ, and the client shall not make individual instructions. All investment profits and losses belong to the clients; principal is not guaranteed. Please consider the investment objectives and nature of risks before investing. As an investment advisory fee for an IAA or an IMA, the amount of assets subject to the contract multiplied by a certain rate (the upper limit is 2.20% per annum (including tax)) shall be incurred in proportion to the contract period. For some strategies, a contingency fee may be incurred in addition to the fee mentioned above. Indirect charges also may be incurred, such as brokerage commissions for incorporated securities. Since these charges and expenses are different depending on a contract and other factors, MSIMJ cannot present the rates, upper limits, etc. in advance. All clients should read the Documents Provided Prior to the Conclusion of a Contract carefully before executing an agreement. This document is disseminated in Japan by MSIMJ, Registered No. 410 (Director of Kanto Local Finance Bureau (Financial Instruments Firms)), Membership: The Japan Securities Dealers Association, the Investment Trusts Association, Japan, the Japan Investment Advisers Association, and the Type II Financial Instruments Firms Association.