Scroll Up Top
Download icon
Download

The fixed income market was as “summer-y” as it gets this past month. Volatility in yields remained remarkably muted, and spreads continued to compress in a benign fashion—despite a brief spike following the early-month U.S. jobs data. This calm seemed out of sync with developments that, under normal circumstances, might have triggered more pronounced market reactions. Beneath the surface, however, pressures are building that could spill into more significant moves as we head into fall.

Our theme this month echoes T.S. Eliot’s sentiment: summer ends not with a bang, but a whimper. Yet perhaps a more fitting metaphor comes from naturalist Joseph Wood Krutch, who wrote, “August creates as she slumbers, replete and satisfied.” The seeds of potential volatility have been sown—and while markets may appear quiet, they are quietly preparing for what’s next.

Rates Rally on Weak Jobs Data and Dovish Signals
Developed market curves steepened in August as soft U.S. payrolls and dovish Fed commentary fueled expectations for rate cuts. Political instability in France and concerns over Fed independence added long-end pressure. The U.S. dollar weakened broadly, supporting high-carry currencies.

Emerging Market Debt Gains Amid Dollar Weakness and Policy Easing
Emerging markets (EM) posted solid returns, supported by continued inflows and easing from Turkey and Mexico. Trade tensions persisted, but a U.S.-China truce helped stabilize sentiment. EM currencies benefited from dollar softness and attractive real yields.

Credit Markets Mixed as Issuance Picks Up
Investment grade (IG) credit saw modest spread widening, led by French assets, while high yield (HY) and convertibles rallied on strong risk appetite and falling yields. Primary issuance was active across segments, with refinancing dominating supply. Fundamentals remain solid, but spreads are tight.

Securitized Credit Stable with Strong Technicals
Agency mortgage-backed securities (MBS) spreads tightened but remain wide historically. Asset-backed securities, Commercial MBS, and Residential MBS issuance was well absorbed despite seasonal slowdown. Performance was solid, though shorter duration limited upside versus other sectors.

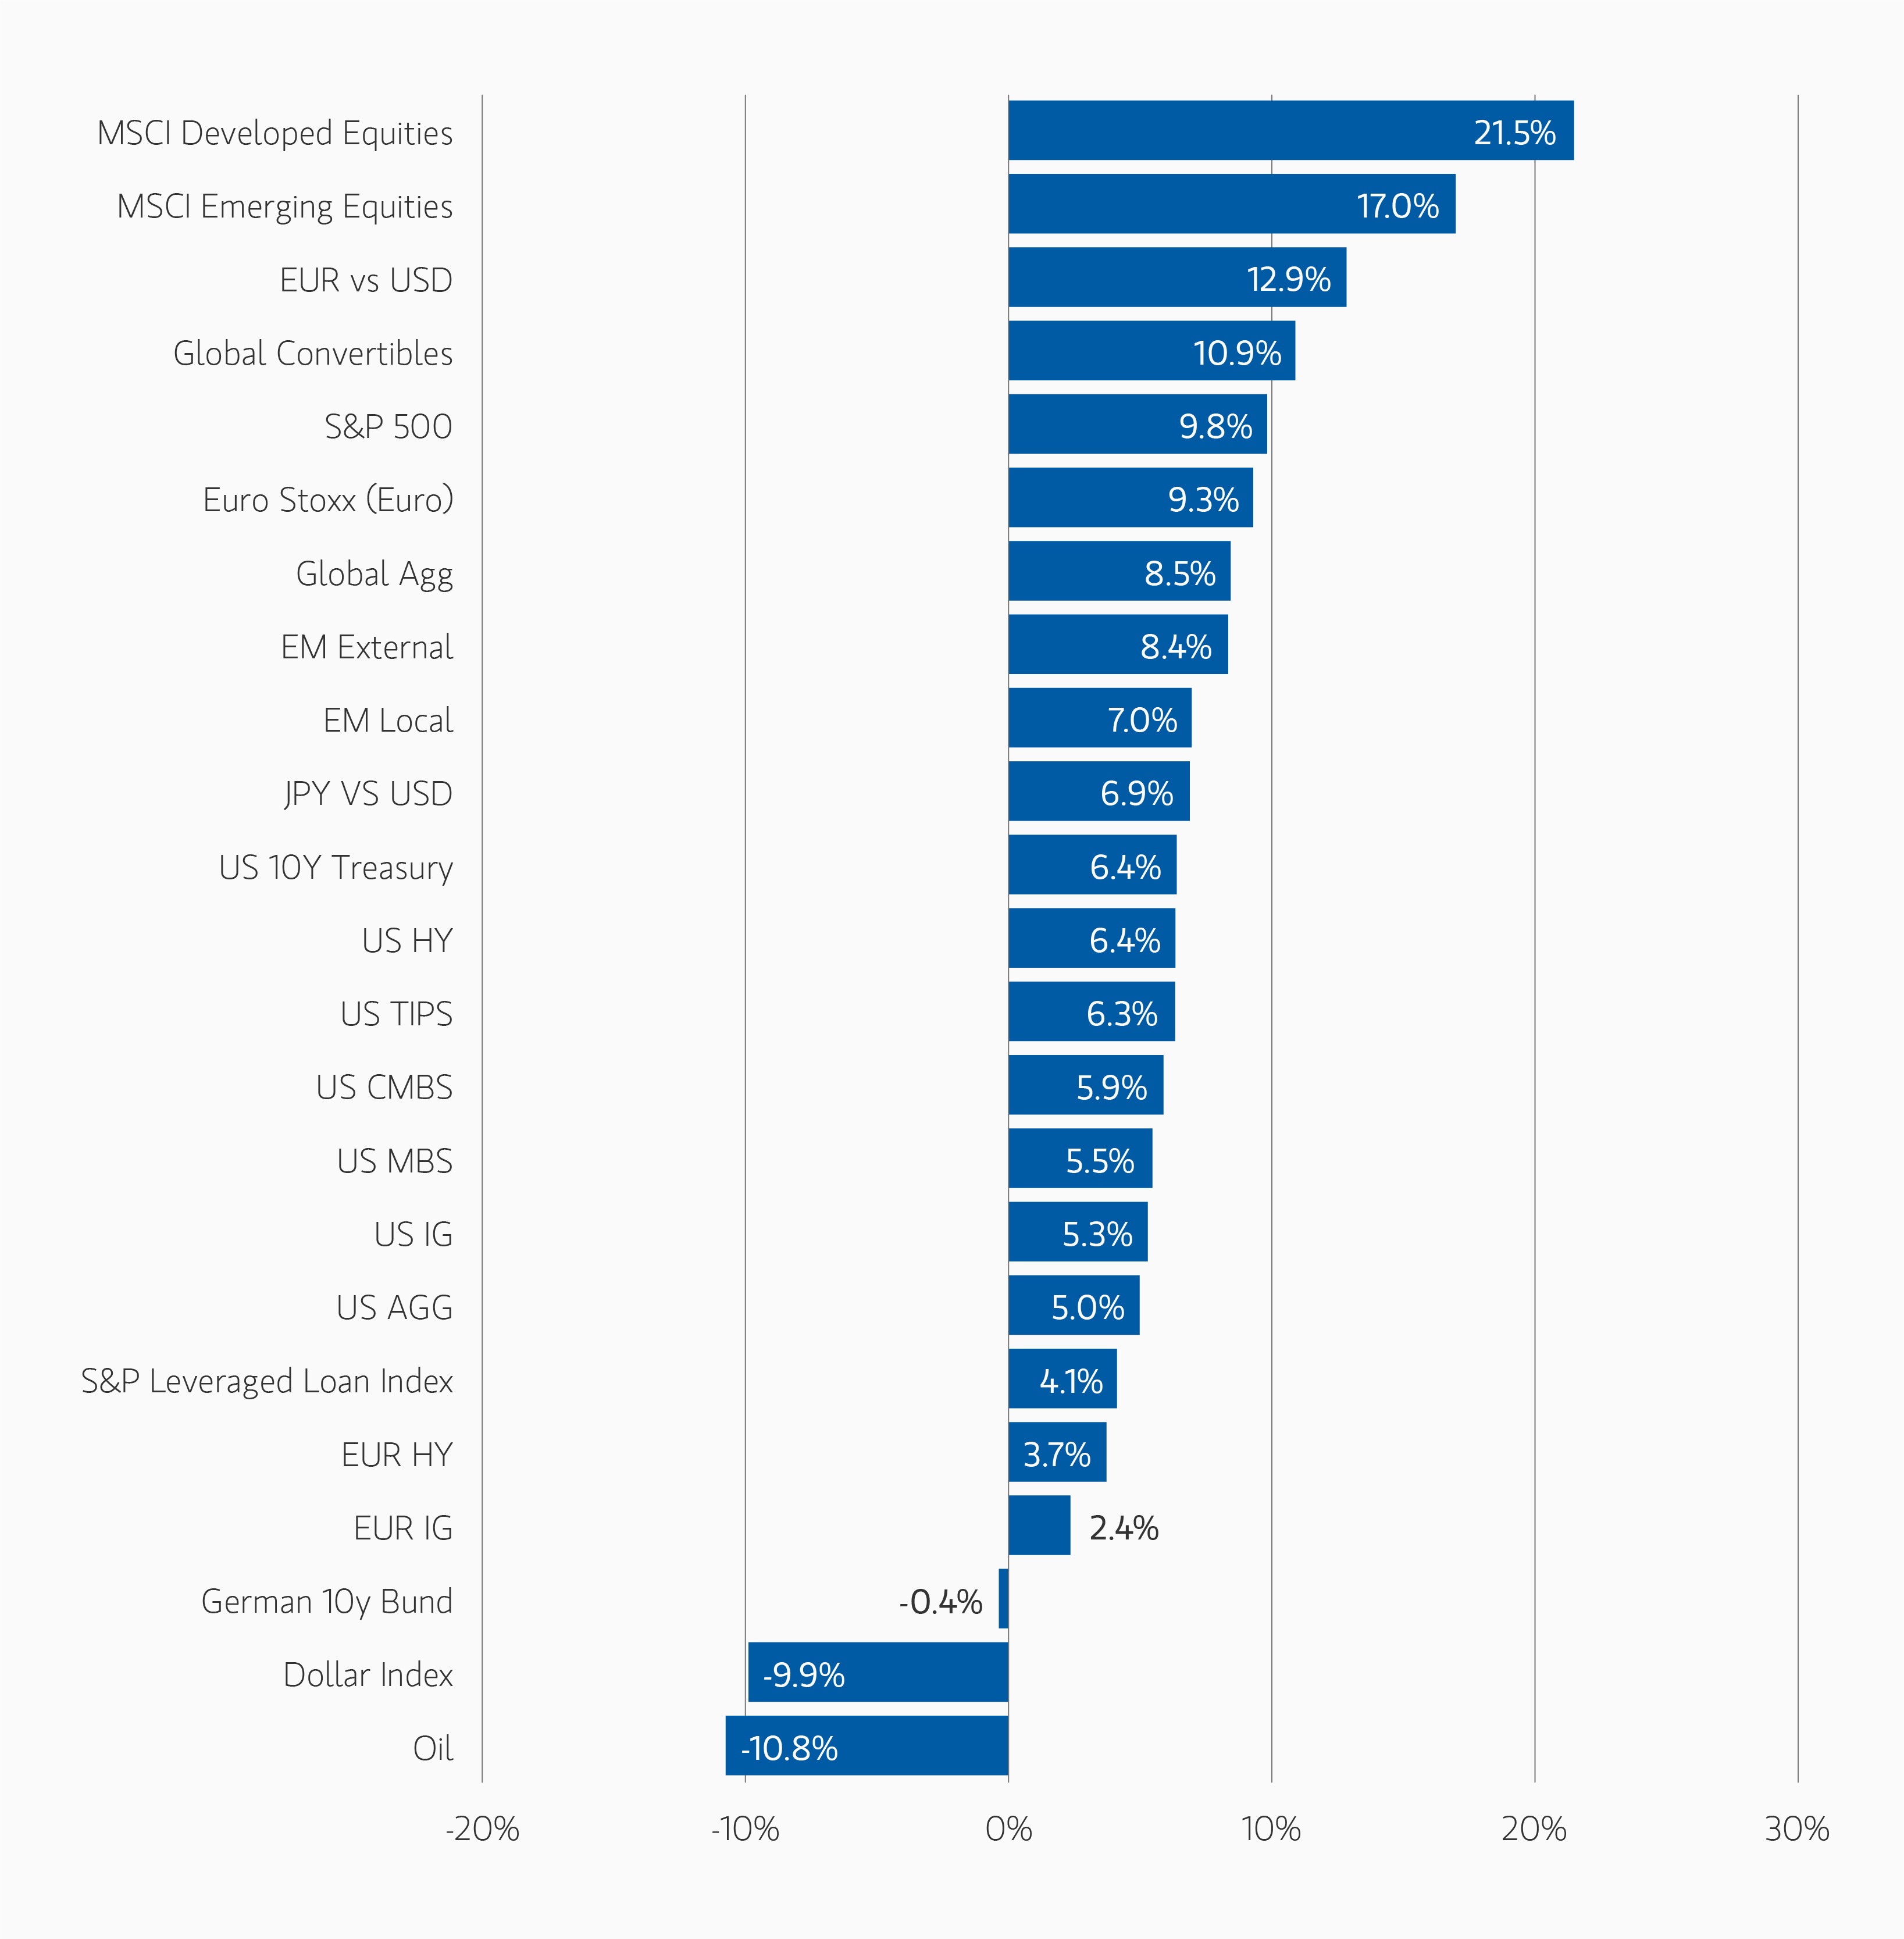
Asset Performance Year-to-Date

DISPLAY 1
article_several-bangs-and-one-whimper_display1.png

Note: USD-based performance. Source: Bloomberg. Data as of August 31, 2025. The indexes are provided for illustrative purposes only and are not meant to depict the performance of a specific investment. Past performance is no guarantee of future results. See below for index definitions.

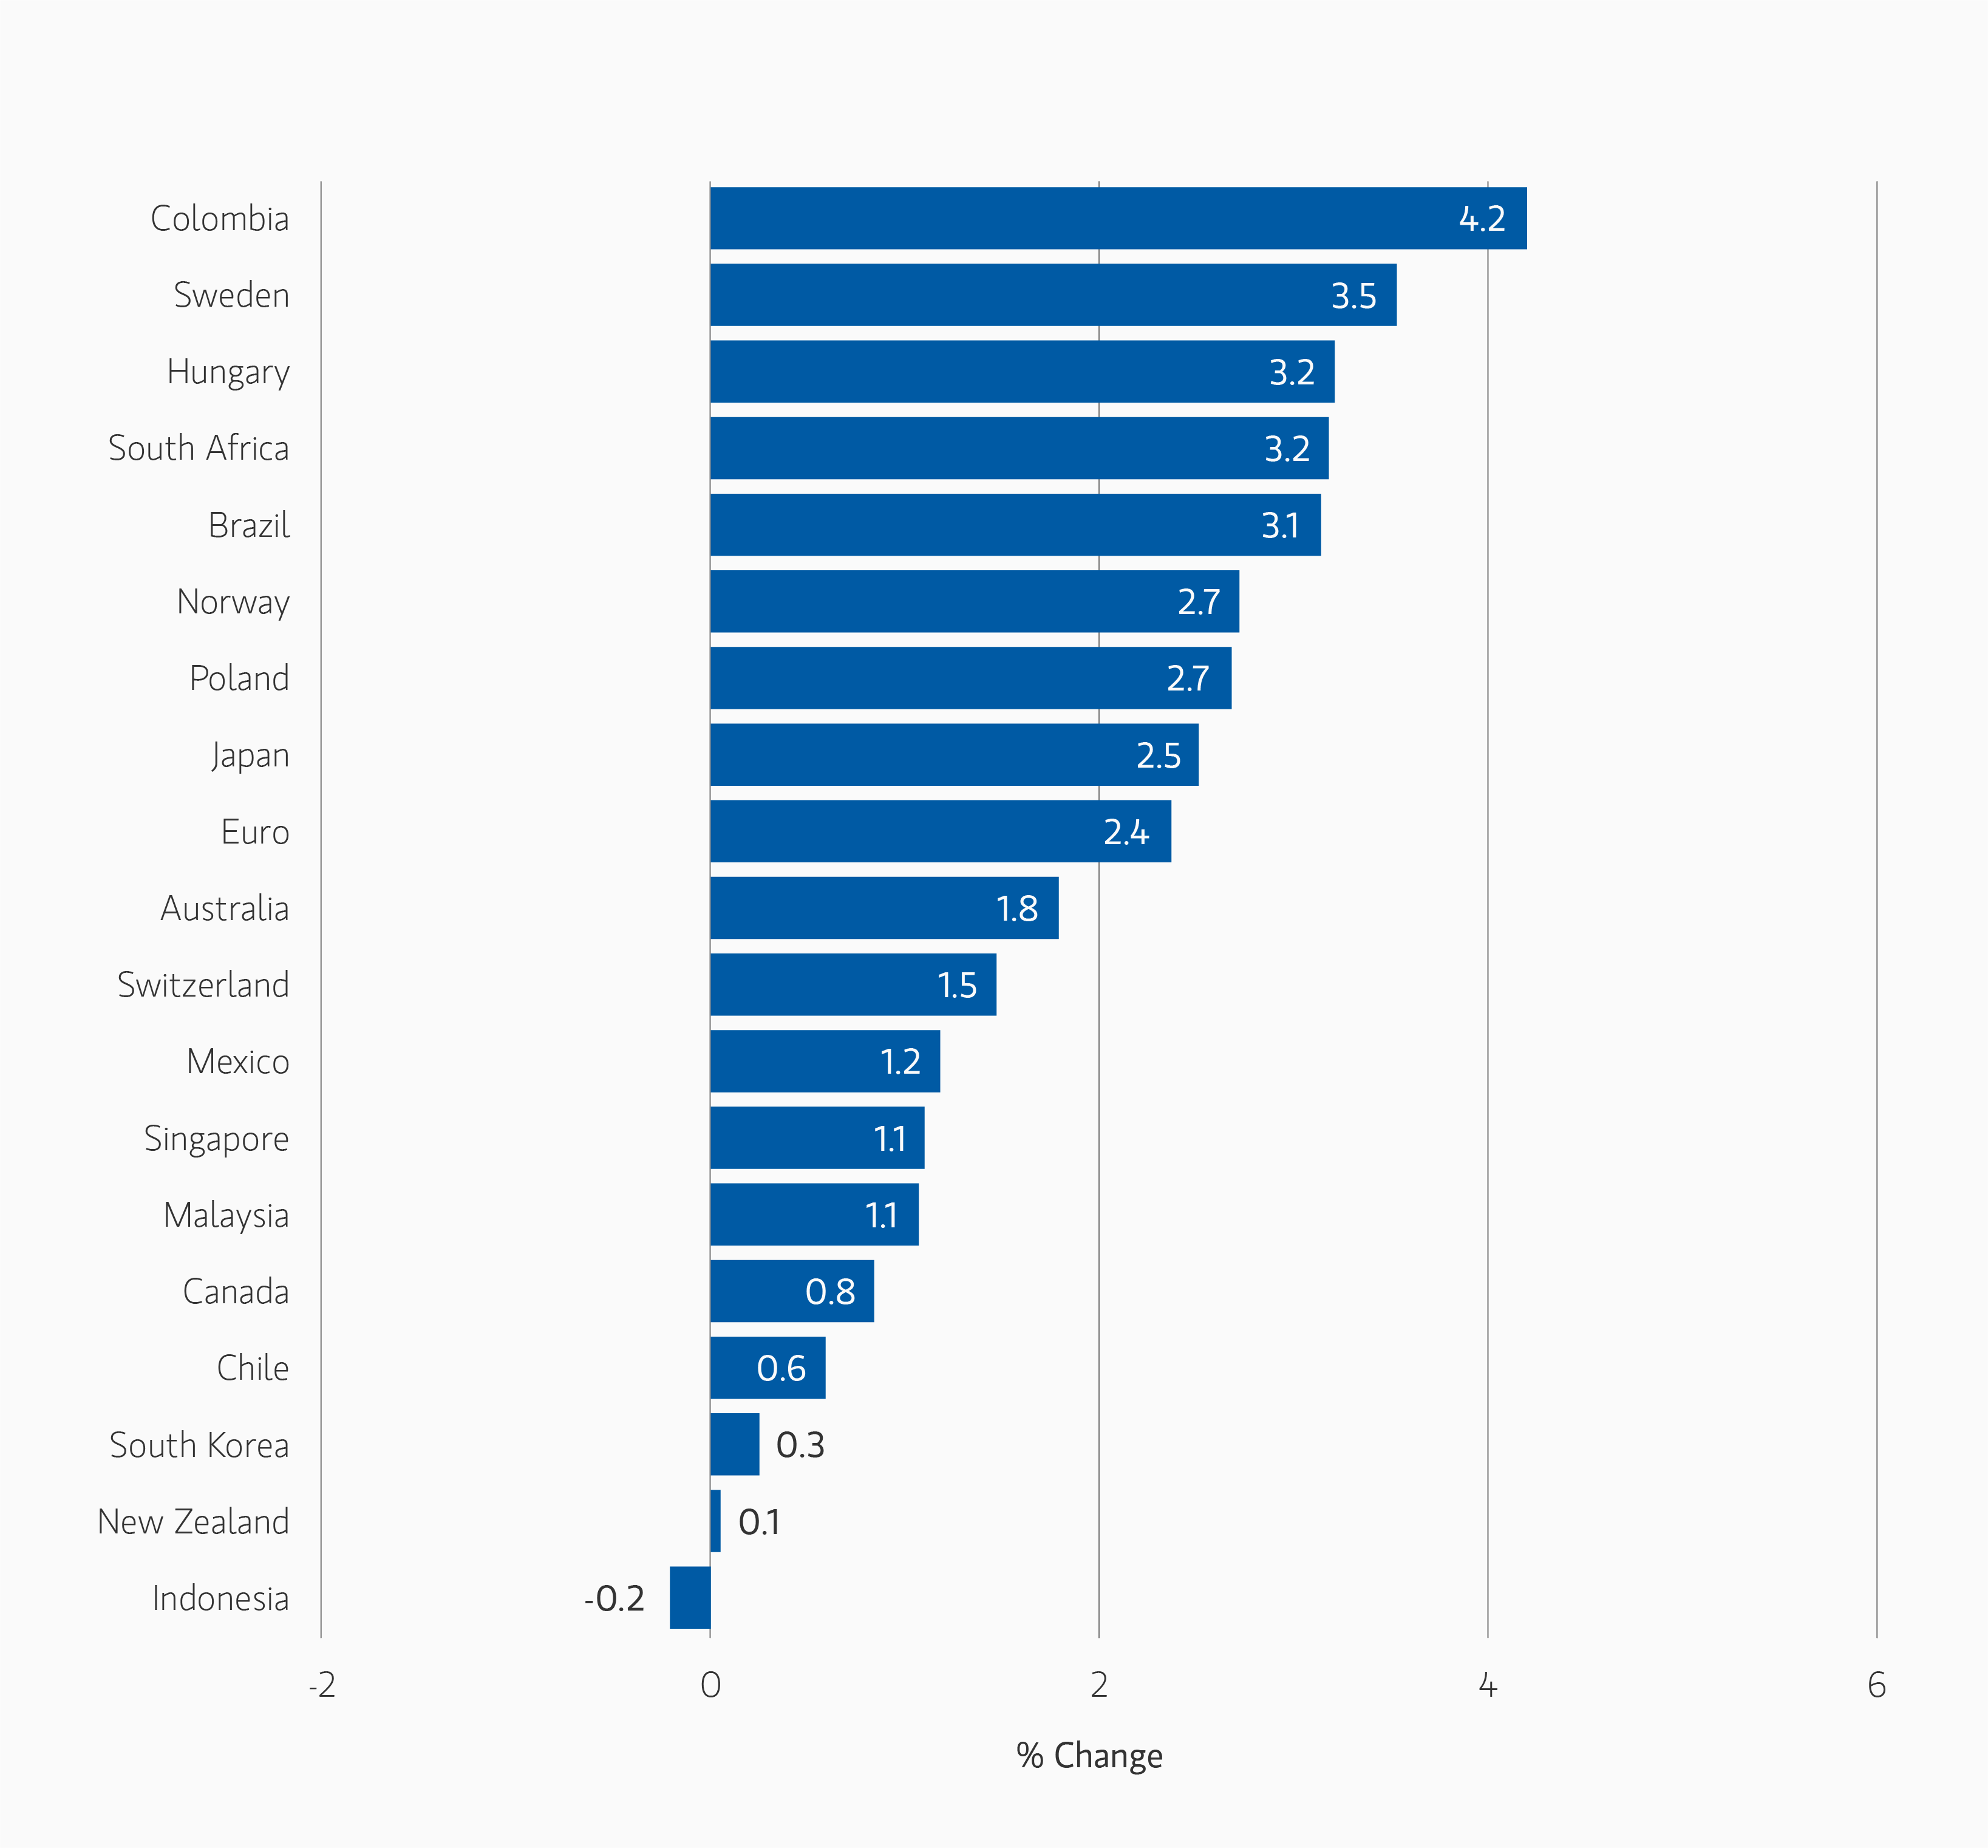
Currency Monthly Changes versus USD

DISPLAY 2
article_several-bangs-and-one-whimper_display2.png

Note: Positive change means appreciation of the currency against the USD. Source: Bloomberg. Data as August 31, 2025.

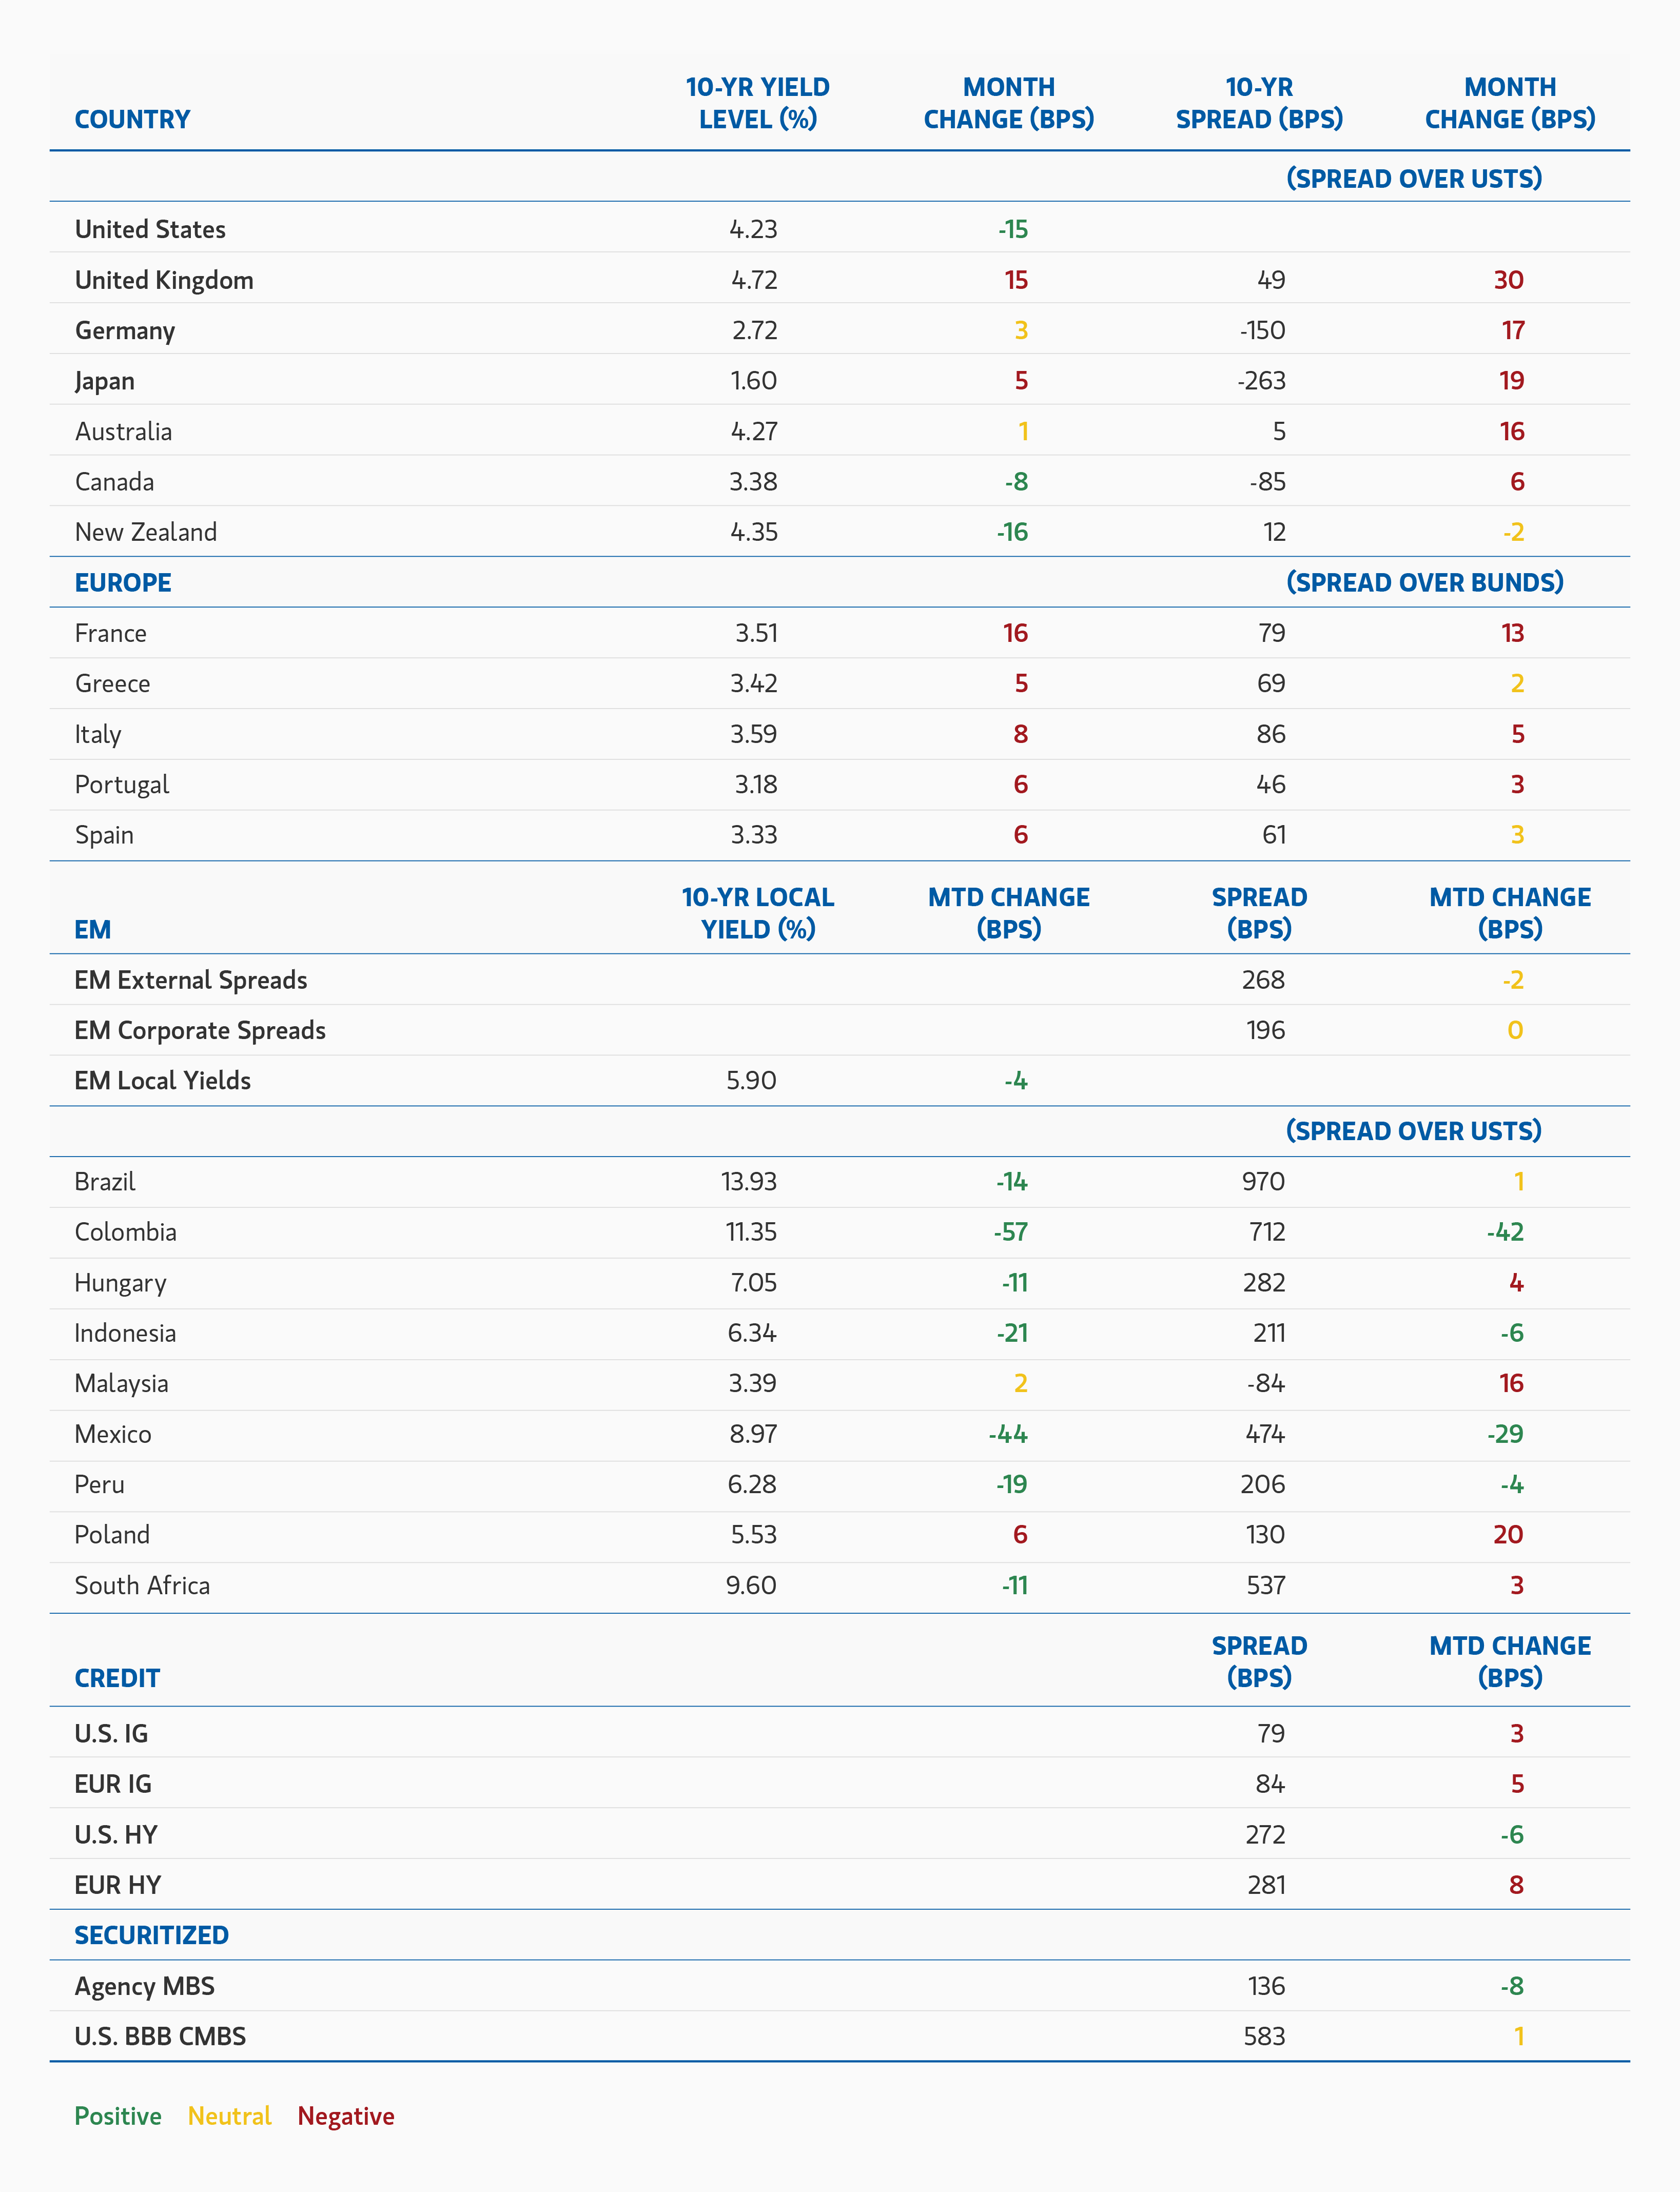
Major Monthly Changes in 10-Year Yields and Spreads

DISPLAY 3
article_several-bangs-and-one-whimper_display3.png

Source: Bloomberg, JPMorgan. Data as of August 31, 2025.

Fixed Income Outlook
The bond market remains in a fragile equilibrium—caught between persistent growth concerns, as reflected in U.S. employment data, and stubborn inflation pressures both domestically and abroad, particularly in Japan. At the same time, supply concerns in government bond markets are intensifying, driven by expanding deficits and politically challenging paths to fiscal tightening in countries such as France, the UK, and the U.S.

These dynamics point to rising term premia, a theme we continue to favor and express through steepener positions in government bond curves. Markets have repriced real yields to levels last seen in the early 2000s, signaling a clear departure from the era of monetary repression that followed the Global Financial Crisis. This shift has occurred despite still-elevated central bank balance sheets, which continue to unwind. The key question now is whether real yields need to rise further—particularly at the long end—as balance sheets shrink and pension demand for duration appears increasingly met.

Against the backdrop of large deficits and structurally constrained fiscal dynamics—driven by political gridlock and demographic pressures—we continue to assess whether we are witnessing implicit crowding out. Corporate and household balance sheets remain strong relative to incomes and profits, and especially when measured against household net worth and equity valuations. Are spreads historically tight not only because private sector fundamentals are sound, but also because sovereign debt trajectories are not?

We maintain a neutral stance on duration across developed markets, with selective positioning favoring Canadian and New Zealand government bonds over U.S. Treasuries. Curve steepening exposures in U.S. Treasuries and German Bunds reflect our view that rising deficits and term premia will pressure long-end yields. In Japan, we remain long inflation breakevens while tactically reducing short duration exposure. In FX, we continue to favor short U.S. dollar positions against a diversified currency basket.

In emerging markets, fundamentals remain supportive amid ongoing reform momentum and resilient growth expectations. EM currencies are undervalued, and real yield differentials remain attractive. Continued dollar weakness should support local assets, though trade policy uncertainty warrants a bottom-up, country-specific approach.

We remain cautiously constructive on credit. In investment grade, solid corporate fundamentals and favorable technicals support carry-driven returns, though tight spreads and trade policy risks call for selectivity. We favor issuers with strong balance sheets and low cyclicality—particularly financials. In high yield, while recession risk remains low, compressed spreads and evolving trade dynamics suggest potential volatility ahead. We prefer issuers with resilient fundamentals and prudent capital structures.

In convertibles, we are constructive on fundamentals but cautious on the pace of issuance—especially crypto-linked deals. The asset class’s bond floor offers downside risk mitigation, and selectivity will be key. In securitized credit, agency MBS spreads are expected to tighten further, supported by attractive relative valuations and potential Fed rate cuts. Residential mortgage credit remains our preferred sector, alongside targeted exposure to commercial ABS and CMBS backed by hospitality assets and select single-asset trophy office properties.


Developed Market Rate/Foreign Currency
Monthly Review
Developed-market yield curves steepened notably in August, reflecting a combination of rising term premia and growing expectations for more aggressive monetary easing. The month opened with a disappointing U.S. payrolls report, which showed only 73,000 jobs added in July. Compounding the weak print were sharp downward revisions to the prior two months, suggesting job growth had slowed to an average of just 35,000 per month. Fed Chair Jerome Powell’s speech at Jackson Hole was interpreted as dovish, emphasizing the potential for rising unemployment amid softening demand. Treasury yields fell across the curve following the speech, and market-implied probabilities for a September rate cut rose significantly. Later in the month, President Trump’s attempt to remove Fed Governor Lisa Cook added further steepening pressure, as markets priced in both a more dovish near-term policy stance and increased long-end risk premia tied to concerns over Fed independence.

In the euro area, monetary policy developments were limited, but political instability in France took center stage. Prime Minister François Bayrou’s announcement of a September 8 confidence vote on his fiscal plan sparked a sharp widening in OAT-Bund spreads and weighed on French risk assets. Encouragingly, the selloff remained largely idiosyncratic, with limited contagion to other regional assets, including the euro. Nonetheless, eurozone sovereign credit spreads drifted wider from their mid-month tights, likely in anticipation of increased government bond issuance in September.

Geopolitical developments had a muted impact on markets. President Trump’s summit with Vladimir Putin in Alaska failed to produce a ceasefire or meaningful progress on Ukraine, despite the symbolic optics. A subsequent high-level meeting in Washington brought together European leaders—including European Commission President von der Leyen, UK Prime Minister Starmer, French President Macron, German Chancellor Merz, and Italian Prime Minister Meloni—to press for stronger U.S. security guarantees for Ukraine. However, markets remained skeptical of any near-term breakthrough.

In foreign exchange markets, the U.S. dollar weakened meaningfully amid falling front-end rates. The Bloomberg Dollar Index declined 1.7%, with the greenback depreciating against all G10 currencies. High-carry currencies—both within the G10 and select emerging markets—continued to rally as investors sought yield in a declining rate environment. Scandinavian currencies outperformed on risk sentiment, while the New Zealand dollar posted a modest 0.05% gain following a dovish Reserve Bank of New Zealand policy meeting.

Outlook
We currently hold a neutral stance on overall duration across developed markets, while maintaining selective cross-market positions. We see relative value in Canadian government bonds versus U.S. Treasuries, supported by Canada’s weakening employment and growth outlook, alongside a steeper yield curve.

We continue to favor an overweight duration position in New Zealand relative to the U.S., and retain our long-standing curve steepening exposures in both U.S. Treasuries and German Bunds. These reflect our view that rising deficits and increasing term premia will likely lead to underperformance at the long end of yield curves.

In Japan, we maintain long inflation breakeven positions, though we have tactically reduced our outright short duration exposure. On the currency front, we remain short the U.S. dollar against a diversified basket of currencies.


Emerging Market Rate/Foreign Currency
Monthly Review
Emerging Markets Debt (EMD) delivered positive performance across major segments in August. The U.S. dollar resumed its weakening trend—seen for much of the year—as investors anticipated a potential rate cut following a soft U.S. jobs report. Credit spreads remained broadly unchanged month-over-month for both sovereign and corporate issuers.

Trade tensions continued to make headlines. The U.S. imposed 50% tariffs on a wide range of Indian imports, with similar measures applied to Brazil. However, a trade truce between the U.S. and China was extended through November, offering some relief to markets.

On the monetary policy front, the Central Bank of Turkey cut its policy rate by 300 basis points (bps) as inflation continued to ease, while the Bank of Mexico delivered a more modest 25 bp cut. Investor appetite for EMD remained strong, with another month of inflows: $2.5 billion into hard currency funds and $1.5 billion into local currency funds.

Outlook
Fundamentals across the asset class remain supportive, underpinned by continued reform momentum in many EM countries. Despite lingering uncertainty around U.S. trade policy, economic cycles in emerging markets are generally on an upswing, and growth expectations remain resilient.

Valuations continue to look attractive. Most EM currencies remain relatively undervalued, and real yield differentials between EM and developed markets are still wide and compelling. A likely continuation of U.S. dollar weakness should further support local currency assets.

While uncertainty around U.S. tariffs persists, the impact will vary by country and will ultimately depend on the outcome of ongoing negotiations. Given the differentiated and bifurcated nature of the asset class, bottom-up country analysis remains essential to identifying and capturing value.


Corporate Credit
Monthly Review
August was a mixed month for risk assets, with macroeconomic developments dominating sentiment. The typical post-summer pickup in primary issuance added pressure to spreads. European IG credit underperformed its U.S. counterpart, largely due to spread decompression in French assets. Political instability re-emerged as a key concern, particularly in France. The surprise announcement of a confidence vote for the French Prime Minister pushed the OAT-Bund spread wider, reflecting growing market anxiety over France’s ability to meet its budgetary targets and address its fiscal deficit. Across the Atlantic, concerns about Federal Reserve independence intensified following President Donald Trump’s attempt to dismiss Fed Governor Lisa Cook. On the monetary policy front, it was a relatively quiet month. The ECB reiterated its commitment to managing potential shocks to the Eurozone economy, while Fed Chair Jerome Powell’s speech at Jackson Hole signaled a more dovish stance, opening the door to a possible rate cut in September. In the UK, the Bank of England delivered a 25 bp rate cut to 4%, consistent with its gradual approach to monetary easing. The Bank highlighted two competing forces: a loosening labor market and persistent inflation, both requiring careful policy calibration. Economic data showed signs of convergence between the U.S. and Europe. August flash PMIs surprised to the upside across the Eurozone, while U.S. ISM services data came in slightly softer than expected—though still in expansionary territory. Technical conditions softened toward the end of the month, driven by a surge in primary market activity. Gross issuance exceeded expectations, totalling €37 billion versus a forecast of €35 billion).1

August was a strong month for U.S. and global high yield markets, with solid performance across both total and excess return metrics. Risk sentiment remained robust, supported by record highs in equity markets and spread compression in the lowest-rated segment of leveraged credit. High yield benefited from a sharp month-over-month decline in 5- and 10-year Treasury yields, driven by growing expectations of a potential rate cut by the Federal Reserve in September. This supportive backdrop encouraged issuers to access receptive capital markets, resulting in a seasonally active month for primary issuance. However, the majority of issuance was refinancing-related, leading to limited net-new supply. The combination of modest net supply, seasonally lower trading volumes, and strong investor demand created a favorable technical environment for high yield.2

Global convertible bonds delivered strong performance in August, supported by robust risk sentiment and growing expectations of a potential rate cut by the Federal Reserve in September. While convertibles underperformed global equities, they outpaced global fixed income, highlighting their hybrid nature in a month marked by equity strength and falling yields. The favorable market tone encouraged issuers to access capital markets, resulting in a seasonally active month for primary issuance. Nearly $12 billion in new deals were priced—approximately double the historical August average. The U.S. led the charge, accounting for 87% of total issuance. Notably, crypto-related issuers continued to tap the market, contributing $4 billion from just two deals. Year-to-date supply reached approximately $95 billion, significantly ahead of the same period in 2024.3

Outlook
We remain cautiously constructive on investment grade credit, anticipating a low-growth environment without a meaningful rise in downgrade or default risk. European policy remains broadly supportive, while the U.S. fiscal outlook is more mixed and subject to political uncertainty. Corporate fundamentals continue to be solid, with issuers maintaining conservative balance sheet strategies and low-risk profiles. Technicals are favorable, supported by manageable issuance levels and sustained demand for investment-grade yields. While we expect carry to remain a key driver of returns, we are mindful of the current extreme tightness in credit spreads. With the full impact of recently announced trade policies yet to materialize, we remain selective in our credit exposures—favoring issuers with strong fundamentals, lower cyclicality, and those well-positioned to benefit from a moderate growth backdrop.

As we move through the third quarter, we maintain a cautious stance on high yield corporates. While peak volatility related to tariff and trade policy may be behind us, the final structure of international trade agreements with key partners remains uncertain. We expect that the evolving trade landscape will continue to weigh on economic growth and contribute to upward pressure on inflation—evidenced by recent labor market data and the mid-August CPI report. Yields remain attractive, but have compressed meaningfully over the quarter, and average spreads in the high yield market are historically tight and vulnerable to widening. Our cautious outlook reflects a comprehensive assessment of factors including U.S. and global growth trajectories, central bank policy shifts, consumer health, issuer fundamentals, technical conditions, and valuations. While we believe the probability of a recession in 2025 remains low, we expect continued episodes of volatility. In this environment, selectivity is key. We favor issuers with resilient fundamentals, prudent capital structures, and business models that are less exposed to cyclical pressures.

We remain constructive on the fundamentals of the global convertible bond market as we move through the third quarter. Convertibles continue to demonstrate their asymmetric return profiles, though equity sensitivity (delta) is gradually increasing. While peak volatility related to trade and tariff policy may be behind us, the final structure of international trade agreements remains uncertain. Additionally, geopolitical tensions in the Middle East appear to have eased, but the durability of the ceasefire will need to be monitored over the medium term. The asset class’s bond floor feature remains a key defensive attribute, particularly if volatility resurfaces as it did in Q2. Despite our constructive view on fundamentals, we remain cautious on the primary market, which is on pace to exceed 2024’s issuance totals. While most issuers are refinancing maturing debt in a high-rate environment, the accelerating trend of crypto-linked issuance—where companies raise capital to purchase cryptocurrency—warrants close scrutiny. We believe this evolving landscape presents both risks and opportunities, especially for well-resourced investment teams with strong bottom-up research capabilities. Selectivity will be critical in navigating the balance between innovation and credit discipline.


Securitized Products
Monthly Review
Interest rates rallied in August, leading to a notable steepening of the yield curve. This shift was driven by two weaker-than-expected U.S. jobs reports, which prompted markets to price in three rate cuts for 2025—up from two the previous month—with the first expected in September. U.S. Treasury yields responded accordingly, with the 2-year falling 34 bps to 3.62% and the 10-year dropping 28 bps from 4.23%. Current coupon agency MBS spreads tightened materially, narrowing by 9 bps to +136 over comparable-duration Treasuries. Despite this move, agency MBS spreads remain wide relative to other core fixed income sectors and historical norms. The Federal Reserve’s MBS holdings declined by $25 billion to $2.095 trillion, marking a $608 billion reduction from their 2022 peak. U.S. bank holdings were unchanged at $2.681 trillion, though expectations for increased holdings are rising as SLR easing and lower short-term rates take effect. Money managers continued to be the primary buyers of MBS, attracted by cheaper valuations.

Securitized credit spreads tightened more than those in other fixed income sectors, though performance was broadly in line due to the shorter duration profile of the asset class. Issuance slowed slightly in August due to seasonal factors, but deals were well-subscribed and easily absorbed by the market. U.S. ABS issuance totaled $18.7 billion, keeping pace with year-to-date volumes from 2024. Non-agency CMBS issuance reached $10.3 billion—its second-highest August total since 2016—and is tracking 42% higher year-over-year. Non-agency RMBS issuance came in at $14.1 billion, slightly above July levels.4 Overall, fixed income returns were strong in August, with longer-duration sectors benefiting most from the rate rally. Securitized credit slightly underperformed relative to other sectors, largely due to its inherently shorter interest rate duration.

Outlook
We remain constructive on U.S. agency MBS spreads, which we expect to continue tightening through September and into Q4. While some spread compression occurred in August, we believe the full extent of tightening will materialize once the Federal Reserve initiates rate cuts later this year as expected. The sector’s attractive return profile—relative to other core fixed income segments and cash alternatives—is likely to draw inflows from both relative value investors and banks, especially as short-term rates decline and regulatory constraints such as SLR ease.

In securitized credit, we expect spreads to remain stable in the near term, pending greater clarity on the economic impact of evolving tariff policies and further tightening in agency MBS spreads. Year-to-date, agency MBS has outperformed corporates, and securitized credit—with its higher carry—has outperformed nearly all other investment-grade fixed income sectors. We anticipate that returns will be primarily driven by cashflow carry in the coming months, supported by attractive yield levels entering September.

However, we remain cautious on certain segments. Current rate levels continue to stress household balance sheets, particularly among lower-income borrowers, which could pressure consumer ABS performance. Commercial real estate also faces headwinds from elevated financing costs. In contrast, residential mortgage credit remains our preferred sector, and we are comfortable extending down the credit spectrum in this space. We remain more selective in lower-rated ABS and CMBS exposures.

Overall, we continue to view agency MBS valuations favorably, especially when compared to investment-grade corporate spreads and historical agency MBS levels. Selectivity and bottom-up credit analysis will be key as we navigate a market shaped by macro uncertainty and evolving policy dynamics.


1 Source: Bloomberg, as of August 31, 2025
2 Source: MSIM, ICE Indices, Bloomberg L.P. Data as of August 31, 2025|
3 Source: Bank of America, August 31, 2025
4 Source: Bloomberg as of August 3, 2025

RISK CONSIDERATIONS

Diversification neither assures a profit nor guarantees against loss in a declining market.

There is no assurance that a portfolio will achieve its investment objective. Portfolios are subject to market risk, which is the possibility that the market values of securities owned by the portfolio will decline and that the value of portfolio shares may therefore be less than what you paid for them. Market values can change daily due to economic and other events (e.g., natural disasters, health crises, terrorism, conflicts, and social unrest) that affect markets, countries, companies, or governments. It is difficult to predict the timing, duration, and potential adverse effects (e.g., portfolio liquidity) of events. Accordingly, you can lose money investing in a portfolio. Fixed-income securities are subject to the ability of an issuer to make timely principal and interest payments (credit risk), changes in interest rates (interest rate risk), the creditworthiness of the issuer and general market liquidity (market risk). In a rising interest-rate environment, bond prices may fall and may result in periods of volatility and increased portfolio redemptions. In a declining interest-rate environment, the portfolio may generate less income. Longer-term securities may be more sensitive to interest rate changes. Certain U.S. government securities purchased by the strategy, such as those issued by Fannie Mae and Freddie Mac, are not backed by the full faith and credit of the U.S. It is possible that these issuers will not have the funds to meet their payment obligations in the future. Public bank loans are subject to liquidity risk and the credit risks of lower-rated securities. High-yield securities (junk bonds) are lower-rated securities that may have a higher degree of credit and liquidity risk. Sovereign debt securities are subject to default risk. Mortgage- and asset-backed securities are sensitive to early prepayment risk and a higher risk of default and may be hard to value and difficult to sell (liquidity risk). They are also subject to credit, market, and interest rate risks. The currency market is highly volatile. Prices in these markets are influenced by, among other things, changing supply and demand for a particular currency; trade; fiscal, money and domestic or foreign exchange control programs and policies; and changes in domestic and foreign interest rates. Investments in foreign markets entail special risks such as currency, political, economic and market risks. The risks of investing in emerging market countries are greater than the risks generally associated with foreign investments. Derivative instruments may disproportionately increase losses and have a significant impact on performance. They also may be subject to counterparty, liquidity, valuation, and correlation and market risks. Restricted and illiquid securities may be more difficult to sell and value than publicly traded securities (liquidity risk). Due to the possibility that prepayments will alter the cash flows on collateralized mortgage obligations (CMOs), it is not possible to determine in advance their final maturity date or average life. In addition, if the collateral securing the CMOs or any third-party guarantees are insufficient to make payments, the portfolio could sustain a loss.

DEFINITIONS

Basis point (bp): One basis point = 0.01%.

INDEX DEFINITIONS
The indexes shown in this report are not meant to depict the performance of any specific investment, and the indexes shown do not include any expenses, fees, or sales charges, which would lower performance. The indexes shown are unmanaged and should not be considered an investment. It is not possible to invest directly in an index.

“Bloomberg®” and the Bloomberg Index/Indices used are service marks of Bloomberg Finance L.P. and its affiliates and have been licensed for use for certain purposes by Morgan Stanley Investment Management (MSIM). Bloomberg is not affiliated with MSIM, does not approve, endorse, review, or recommend any product, and. does not guarantee the timeliness, accurateness, or completeness of any data or information relating to any product.

The Bloomberg Euro Aggregate Corporate Index (Bloomberg Euro IG Corporate) is an index designed to reflect the performance of the euro-denominated investment-grade corporate bond market.

The Bloomberg Global Aggregate Corporate Index is the corporate component of the Bloomberg Global Aggregate index, which provides a broad-based measure of the global investment-grade fixed income markets.

The Bloomberg US Corporate High Yield Index measures the market of USD-denominated, non-investment grade, fixed-rate, taxable corporate bonds. Securities are classified as high yield if the middle rating of Moody’s, Fitch, and S&P is Ba1/BB+/BB+ or below. The index excludes emerging market debt.

The Bloomberg US Corporate Index is a broad-based benchmark that measures the investment grade, fixed-rate, taxable, corporate bond market.

The Bloomberg US Mortgage-Backed Securities (MBS) Index tracks agency mortgage-backed pass-through securities (both fixed-rate and hybrid ARM) guaranteed by Ginnie Mae (GNMA), Fannie Mae (FNMA) and Freddie Mac (FHLMC). The index is constructed by grouping individual TBA-deliverable MBS pools into aggregates or generics based on program, coupon, and vintage. Introduced in 1985, the GNMA, FHLMC and FNMA fixed-rate indexes for 30- and 15-year securities were backdated to January 1976, May 1977, and November 1982, respectively. In April 2007, agency hybrid adjustable-rate mortgage (ARM) pass-through securities were added to the index.

Consumer Price Index (CPI) is a measure that examines the weighted average of prices of a basket of consumer goods and services, such as transportation, food, and medical care.

Euro vs. USD—Euro total return versus U.S. dollar.

German 10YR bonds—Germany Benchmark 10-Year Datastream Government Index; Japan 10YR government bonds —Japan Benchmark 10-Year Datastream Government Index; and 10YR US Treasury—US Benchmark 10-Year Datastream Government Index.

The ICE BofAML European Currency High-Yield Constrained Index (ICE BofAML Euro HY constrained) is designed to track the performance of euro- and British pound sterling-denominated below investment-grade corporate debt publicly issued in the Eurobond, sterling.

The ICE BofAML US Mortgage-Backed Securities (ICE BofAML US Mortgage Master) Index tracks the performance of US dollar-denominated, fixed-rate and hybrid residential mortgage pass-through securities publicly issued by US agencies in the US domestic market.

The ICE BofAML US High Yield Master II Constrained Index (ICE BofAML US High Yield) is a market value-weighted index of all domestic and Yankee high-yield bonds, including deferred-interest bonds and payment-in-kind securities. Its securities have maturities of one year or more and a credit rating lower than BBB-/Baa3 but are not in default.

The ISM Manufacturing Index is based on surveys of more than 300 manufacturing firms by the Institute of Supply Management. The ISM Manufacturing Index monitors employment, production inventories, new orders, and supplier deliveries. A composite diffusion index is created that monitors conditions in national manufacturing based on the data from these surveys.

Italy 10-Year Government Bonds—Italy Benchmark 10-Year Datastream Government Index.

The JP Morgan CEMBI Broad Diversified Index is a global, liquid corporate emerging markets benchmark that tracks US-denominated corporate bonds issued by emerging markets entities.

The JPMorgan Government Bond Index—emerging markets (JPM local EM debt) tracks local currency bonds issued by emerging market governments. The index is positioned as the investable benchmark that includes only those countries that are accessible by most of the international investor base (excludes China and India as of September 2013).

The JPMorgan Government Bond Index Emerging Markets (JPM External EM Debt) tracks local currency bonds issued by emerging market governments. The index is positioned as the investable benchmark that includes only those countries that are accessible by most of the international investor base (excludes China and India as of September 2013).

The JP Morgan Emerging Markets Bond Index Global (EMBI Global) tracks total returns for traded external debt instruments in the emerging markets and is an expanded version of the EMBI+. As with the EMBI+, the EMBI Global includes US dollar-denominated Brady bonds, loans, and Eurobonds with an outstanding face value of at least $500 million.

The JP Morgan GBI-EM Global Diversified Index is a market-capitalization weighted, liquid global benchmark for US-dollar corporate emerging market bonds representing Asia, Latin America, Europe, and the Middle East/Africa.

JPY vs. USD—Japanese yen total return versus US dollar.

The Markit ITraxx Europe Index comprises 125 equally weighted credit default swaps on investment grade European corporate entities, distributed among 4 sub-indices: Financials (Senior & Subordinated), Non-Financials and HiVol.

The Nikkei 225 Index (Japan Nikkei 225) is a price-weighted index of Japan’s top 225 blue-chip companies on the Tokyo Stock Exchange.

The MSCI AC Asia ex-Japan Index (MSCI Asia ex-Japan) captures large- and mid-cap representation across two of three developed markets countries (excluding Japan) and eight emerging markets countries in Asia.

The MSCI All Country World Index (ACWI, MSCI global equities) is a free float-adjusted market capitalization weighted index designed to measure the equity market performance of developed and emerging markets. The term "free float" represents the portion of shares outstanding that are deemed to be available for purchase in the public equity markets by investors. The performance of the Index is listed in US dollars and assumes reinvestment of net dividends.

MSCI Emerging Markets Index (MSCI emerging equities) captures large- and mid-cap representation across 23 emerging markets (EM) countries.

The MSCI World Index (MSCI developed equities) captures large and mid-cap representation across 23 developed market (DM) countries.

Purchasing Managers Index (PMI) is an indicator of the economic health of the manufacturing sector.

The Refinitiv Convertible Global Focus USD Hedged Index is a market weighted index with a minimum size for inclusion of $500 million (US), 200 million (Europe), 22 billion Yen, and $275 million (Other) of Convertible Bonds with an Equity Link.

The Russell 2000® Index is an index that measures the performance of the 2,000 smallest companies in the Russell 3000 Index.

The S&P 500® Index (US S&P 500) measures the performance of the large-cap segment of the US equities market, covering approximately 75 percent of the US equities market. The index includes 500 leading companies in leading industries of the U.S. economy.

S&P CoreLogic Case-Shiller US National Home Price NSA Index seeks to measure the value of residential real estate in 20 major US metropolitan areas: Atlanta, Boston, Charlotte, Chicago, Cleveland, Dallas, Denver, Detroit, Las Vegas, Los Angeles, Miami, Minneapolis, New York, Phoenix, Portland, San Diego, San Francisco, Seattle, Tampa and Washington, D.C.

The S&P/LSTA US Leveraged Loan 100 Index (S&P/LSTA Leveraged Loan Index) is designed to reflect the performance of the largest facilities in the leveraged loan market.

The S&P GSCI Copper Index (Copper), a sub-index of the S&P GSCI, provides investors with a reliable and publicly available benchmark for investment performance in the copper commodity market.

The S&P GSCI Softs (GSCI soft commodities) Index is a sub-index of the S&P GSCI that measures the performance of only the soft commodities, weighted on a world production basis. In 2012, the S&P GSCI Softs Index included the following commodities: coffee, sugar, cocoa, and cotton.

Spain 10-Year Government Bonds—Spain Benchmark 10-Year Datastream Government Index.

The Thomson Reuters Convertible Global Focus USD Hedged Index is a market weighted index with a minimum size for inclusion of $500 million (US), 200 million euro (Europe), 22 billion yen, and $275 million (Other) of convertible bonds with an equity link.

U.K. 10YR government bonds—U.K. Benchmark 10-Year Datastream Government Index. For the following Datastream government bond indexes, benchmark indexes are based on single bonds. The bond chosen for each series is the most representative bond available for the given maturity band at each point in time. Benchmarks are selected according to the accepted conventions within each market. Generally, the benchmark bond is the latest issue within the given maturity band; consideration is also given to yield, liquidity, issue size and coupon.

The US Dollar Index (DXY) is an index of the value of the United States dollar relative to a basket of foreign currencies, often referred to as a basket of US trade partners’ currencies.

The Chicago Board Options Exchange (CBOE) Market Volatility (VIX) Index shows the market’s expectation of 30-day volatility.

There is no guarantee that any investment strategy will work under all market conditions, and each investor should evaluate their ability to invest for the long-term, especially during periods of downturn in the market.

A separately managed account may not be appropriate for all investors. Separate accounts managed according to the particular strategy may include securities that may not necessarily track the performance of a particular index. Please consider the investment objectives, risks and fees of the Strategy carefully before investing. A minimum asset level is required. For important information about the investment managers, please refer to Form ADV Part 2.

The views and opinions and/or analysis expressed are those of the author or the investment team as of the date of preparation of this material and are subject to change at any time without notice due to market or economic conditions and may not necessarily come to pass. Furthermore, the views will not be updated or otherwise revised to reflect information that subsequently becomes available or circumstances existing, or changes occurring, after the date of publication. The views expressed do not reflect the opinions of all investment personnel at Morgan Stanley Investment Management (MSIM) and its subsidiaries and affiliates (collectively “the Firm”) and may not be reflected in all the strategies and products that the Firm offers.

Forecasts and/or estimates provided herein are subject to change and may not actually come to pass. Information regarding expected market returns and market outlooks is based on the research, analysis and opinions of the authors or the investment team. These conclusions are speculative in nature, may not come to pass and are not intended to predict the future performance of any specific strategy or product the Firm offers. Future results may differ significantly depending on factors such as changes in securities or financial markets or general economic conditions.

This material has been prepared on the basis of publicly available information, internally developed data and other third-party sources believed to be reliable. However, no assurances are provided regarding the reliability of such information and the Firm has not sought to independently verify information taken from public and third-party sources.

This material is a general communication, which is not impartial, and all information provided has been prepared solely for informational and educational purposes and does not constitute an offer or a recommendation to buy or sell any particular security or to adopt any specific investment strategy. The information herein has not been based on a consideration of any individual investor circumstances and is not investment advice, nor should it be construed in any way as tax, accounting, legal or regulatory advice. To that end, investors should seek independent legal and financial advice, including advice as to tax consequences, before making any investment decision.

Charts and graphs provided herein are for illustrative purposes only. Past performance is no guarantee of future results.

The indexes are unmanaged and do not include any expenses, fees, or sales charges. It is not possible to invest directly in an index. Any index referred to herein is the intellectual property (including registered trademarks) of the applicable licensor. Any product based on an index is in no way sponsored, endorsed, sold, or promoted by the applicable licensor and it shall not have any liability with respect thereto.

This material is not a product of Morgan Stanley’s Research Department and should not be regarded as a research material or a recommendation.

The Firm has not authorized financial intermediaries to use and to distribute this material unless such use and distribution is made in accordance with applicable law and regulation. Additionally, financial intermediaries are required to satisfy themselves that the information in this material is appropriate for any person to whom they provide this material in view of that person’s circumstances and purpose. The Firm shall not be liable for, and accepts no liability for, the use or misuse of this material by any such financial intermediary.

This material may be translated into other languages. Where such a translation is made this English version remains definitive. If there are any discrepancies between the English version and any version of this material in another language, the English version shall prevail.

The whole or any part of this material may not be directly or indirectly reproduced, copied, modified, used to create a derivative work, performed, displayed, published, posted, licensed, framed, distributed, or transmitted or any of its contents disclosed to third parties without the Firm’s express written consent. This material may not be linked to unless such hyperlink is for personal and non-commercial use. All information contained herein is proprietary and is protected under copyright and other applicable law.

Eaton Vance is part of Morgan Stanley Investment Management. Morgan Stanley Investment Management is the asset management division of Morgan Stanley.

DISTRIBUTION
This material is only intended for and will only be distributed to persons resident in jurisdictions where such distribution or availability would not be contrary to local laws or regulations.

MSIM, the asset management division of Morgan Stanley (NYSE: MS), and its affiliates have arrangements in place to market each other’s products and services. Each MSIM affiliate is regulated as appropriate in the jurisdiction it operates. MSIM’s affiliates are: Eaton Vance Management (International) Limited, Eaton Vance Advisers International Ltd, Calvert Research and Management, Eaton Vance Management, Parametric Portfolio Associates LLC, and Atlanta Capital Management LLC.

This material has been issued by any one or more of the following entities:

EMEA:
This material is for Professional Clients/Accredited Investors only.

In the EU, MSIM and Eaton Vance materials are issued by MSIM Fund Management (Ireland) Limited (“FMIL”). FMIL is regulated by the Central Bank of Ireland and is incorporated in Ireland as a private company limited by shares with company registration number 616661 and has its registered address at 24-26 City Quay, Dublin 2, D02 NY 19, Ireland.

Outside the EU, MSIM materials are issued by Morgan Stanley Investment Management Limited (MSIM Ltd) is authorised and regulated by the Financial Conduct Authority. Registered in England. Registered No. 1981121. Registered Office: 25 Cabot Square, Canary Wharf, London E14 4QA.

In Switzerland, MSIM materials are issued by Morgan Stanley & Co. International plc, London (Zurich Branch) Authorised and regulated by the Eidgenössische Finanzmarktaufsicht ("FINMA"). Registered Office: Beethovenstrasse 33, 8002 Zurich, Switzerland.

Outside the US and EU, Eaton Vance materials are issued by Eaton Vance Management (International) Limited (“EVMI”) 125 Old Broad Street, London, EC2N 1AR, UK, which is authorised and regulated in the United Kingdom by the Financial Conduct Authority.

Italy: MSIM FMIL (Milan Branch), (Sede Secondaria di Milano) Palazzo Serbelloni Corso Venezia, 16 20121 Milano, Italy. The Netherlands: MSIM FMIL (Amsterdam Branch), Rembrandt Tower, 11th Floor Amstelplein 1 1096HA, Netherlands. France: MSIM FMIL (Paris Branch), 61 rue de Monceau 75008 Paris, France. Spain: MSIM FMIL (Madrid Branch), Calle Serrano 55, 28006, Madrid, Spain. Germany: Germany: MSIM FMIL (Frankfurt Branch), Grosse Gallusstrasse 18, 60312 Frankfurt am Main, Germany (Gattung: Zweigniederlassung (FDI) gem. § 53b KWG). Denmark: MSIM FMIL (Copenhagen Branch), Gorrissen Federspiel, Axel Towers, Axeltorv2, 1609 Copenhagen V, Denmark.

MIDDLE EAST
Dubai:
MSIM Ltd (Representative Office, Unit Precinct 3-7th Floor-Unit 701 and 702, Level 7, Gate Precinct Building 3, Dubai International Financial Centre, Dubai, 506501, United Arab Emirates. Telephone: +97 (0)14 709 7158). This document is distributed in the Dubai International Financial Centre by Morgan Stanley Investment Management Limited (Representative Office), an entity regulated by the Dubai Financial Services Authority (“DFSA”). It is intended for use by professional clients and market counterparties only. This document is not intended for distribution to retail clients, and retail clients should not act upon the information contained in this document.

This document relates to a financial product which is not subject to any form of regulation or approval by the DFSA. The DFSA has no responsibility for reviewing or verifying any documents in connection with this financial product. Accordingly, the DFSA has not approved this document or any other associated documents nor taken any steps to verify the information set out in this document and has no responsibility for it. The financial product to which this document relates may be illiquid and/or subject to restrictions on its resale or transfer. Prospective purchasers should conduct their own due diligence on the financial product. If you do not understand the contents of this document, you should consult an authorized financial adviser.

US
NOT FDIC INSURED | OFFER NO BANK GUARANTEE | MAY LOSE VALUE | NOT INSURED BY ANY FEDERAL GOVERNMENT AGENCY | NOT A DEPOSIT

Latin America (Brazil, Chile Colombia, Mexico, Peru, and Uruguay)
This material is for use with an institutional investor or a qualified investor only. All information contained herein is confidential and is for the exclusive use and review of the intended addressee and may not be passed on to any third party. This material is provided for informational purposes only and does not constitute a public offering, solicitation, or recommendation to buy or sell for any product, service, security and/or strategy. A decision to invest should only be made after reading the strategy documentation and conducting in-depth and independent due diligence.

ASIA PACIFIC
Hong Kong:
This material is disseminated by Morgan Stanley Asia Limited for use in Hong Kong and shall only be made available to “professional investors” as defined under the Securities and Futures Ordinance of Hong Kong (Cap 571). The contents of this material have not been reviewed nor approved by any regulatory authority including the Securities and Futures Commission in Hong Kong. Accordingly, save where an exemption is available under the relevant law, this material shall not be issued, circulated, distributed, directed at, or made available to, the public in Hong Kong. Singapore: This material is disseminated by Morgan Stanley Investment Management Company and may not be circulated or distributed, whether directly or indirectly, to persons in Singapore other than to (i) an accredited investor (ii) an expert investor or (iii) an institutional investor as defined in Section 4A of the Securities and Futures Act, Chapter 289 of Singapore (“SFA”); or (iv) otherwise pursuant to, and in accordance with the conditions of, any other applicable provision of the SFA. This publication has not been reviewed by the Monetary Authority of Singapore. Australia: This material is provided by Morgan Stanley Investment Management (Australia) Pty Ltd ABN 22122040037, AFSL No. 314182 and its affiliates and does not constitute an offer of interests. Morgan Stanley Investment Management (Australia) Pty Limited arranges for MSIM affiliates to provide financial services to Australian wholesale clients. Interests will only be offered in circumstances under which no disclosure is required under the Corporations Act 2001 (Cth) (the “Corporations Act”). Any offer of interests will not purport to be an offer of interests in circumstances under which disclosure is required under the Corporations Act and will only be made to persons who qualify as a “wholesale client” (as defined in the Corporations Act). This material will not be lodged with the Australian Securities and Investments Commission. 

Japan: For professional investors, this document is circulated or distributed for informational purposes only. For those who are not professional investors, this document is provided in relation to Morgan Stanley Investment Management (Japan) Co., Ltd. (“MSIMJ”)’s business with respect to discretionary investment management agreements (“IMA”) and investment advisory agreements (“IAA”). This is not for the purpose of a recommendation or solicitation of transactions or offers any particular financial instruments. Under an IMA, with respect to management of assets of a client, the client prescribes basic management policies in advance and commissions MSIMJ to make all investment decisions based on an analysis of the value, etc. of the securities, and MSIMJ accepts such commission. The client shall delegate to MSIMJ the authorities necessary for making investment. MSIMJ exercises the delegated authorities based on investment decisions of MSIMJ, and the client shall not make individual instructions. All investment profits and losses belong to the clients; principal is not guaranteed. Please consider the investment objectives and nature of risks before investing. As an investment advisory fee for an IAA or an IMA, the amount of assets subject to the contract multiplied by a certain rate (the upper limit is 2.20% per annum (including tax)) shall be incurred in proportion to the contract period. For some strategies, a contingency fee may be incurred in addition to the fee mentioned above. Indirect charges also may be incurred, such as brokerage commissions for incorporated securities. Since these charges and expenses are different depending on a contract and other factors, MSIMJ cannot present the rates, upper limits, etc. in advance. All clients should read the Documents Provided Prior to the Conclusion of a Contract carefully before executing an agreement. This document is disseminated in Japan by MSIMJ, Registered No. 410 (Director of Kanto Local Finance Bureau (Financial Instruments Firms)), Membership: The Japan Securities Dealers Association, the Investment Trusts Association, Japan, the Japan Investment Advisers Association, and the Type II Financial Instruments Firms Association.