Scroll Up Top
Download icon
Download

June was marked by a continuation of the risk-on sentiment that began earlier in the quarter, supported by resilient economic data, a modest decline in volatility, and easing geopolitical tension following the brief conflict between Israel and Iran. Developed market government bond yields were mixed: U.S. 10-year yields fell 17 basis points (bps) to 4.23%, while German Bund yields rose 10 bps amid hawkish ECB signals and increased fiscal spending. The U.S. dollar weakened 2.1% against a basket of currencies, with all G10 currencies except the yen appreciating, and Emerging Market (EM) currencies broadly outperforming.

Emerging market debt posted strong returns, buoyed by a weaker dollar, positive fund flows, and tightening spreads across both sovereign and corporate credit. Local rates outperformed global peers, and geopolitical risks had limited lasting impact on market sentiment. South Africa, Brazil, and Indonesia saw notable yield declines, while countries like Hungary and South Korea experienced modest increases.

Corporate credit rallied across the board. U.S. and European high yield outperformed investment grade, driven by strong technicals, solid corporate fundamentals, and declining Treasury yields. Euro Investment Grade (IG) led within investment grade, supported by robust demand and favorable issuance dynamics. Securitized products also performed well, with agency MBS spreads tightening by 8 bps and non-agency Residential Mortgage-Backed Securities (RMBS) and Commercial MBS (CMBS) spreads narrowing amid strong issuance and resilient credit fundamentals.

Looking ahead, markets are pricing in two to three Fed rate cuts by year-end, though inflationary risks from tariffs and fiscal expansion remain a key uncertainty. We remain constructive on duration in developed markets, favor steepening exposures in the U.S. and Europe, and continue to see value in EM debt and securitized credit, particularly agency MBS and residential mortgage-backed securities.

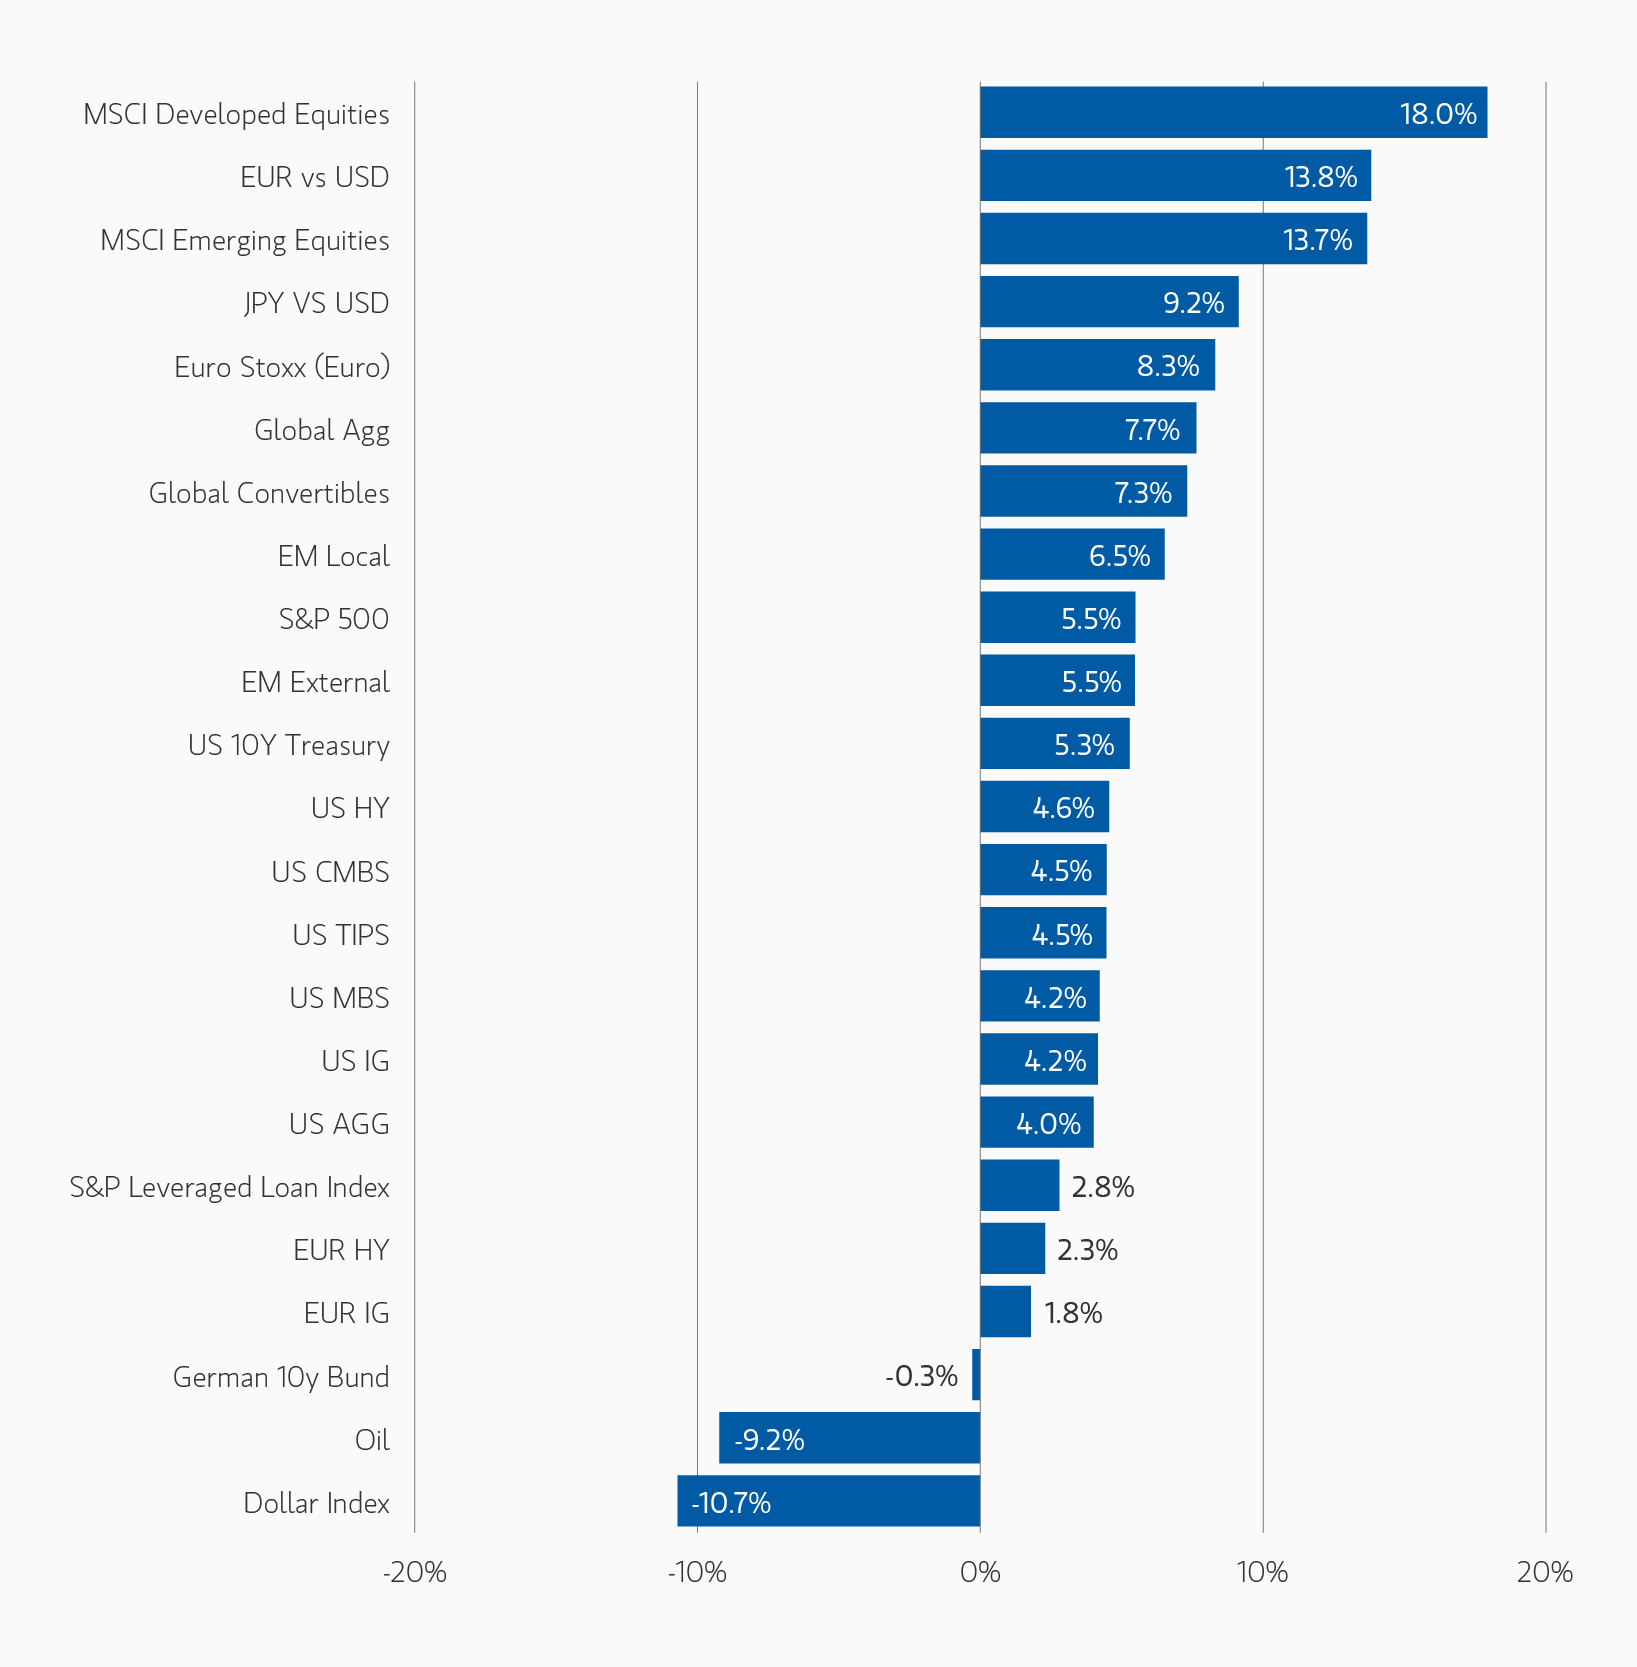
Asset Performance Year-to-Date

DISPLAY 1
insight_wating-for-godot-fixed-income-edition_display-1.png

Note: USD-based performance. Source: Bloomberg. Data as of June 30, 2025. The indexes are provided for illustrative purposes only and are not meant to depict the performance of a specific investment. Past performance is no guarantee of future results. See below for index definitions.

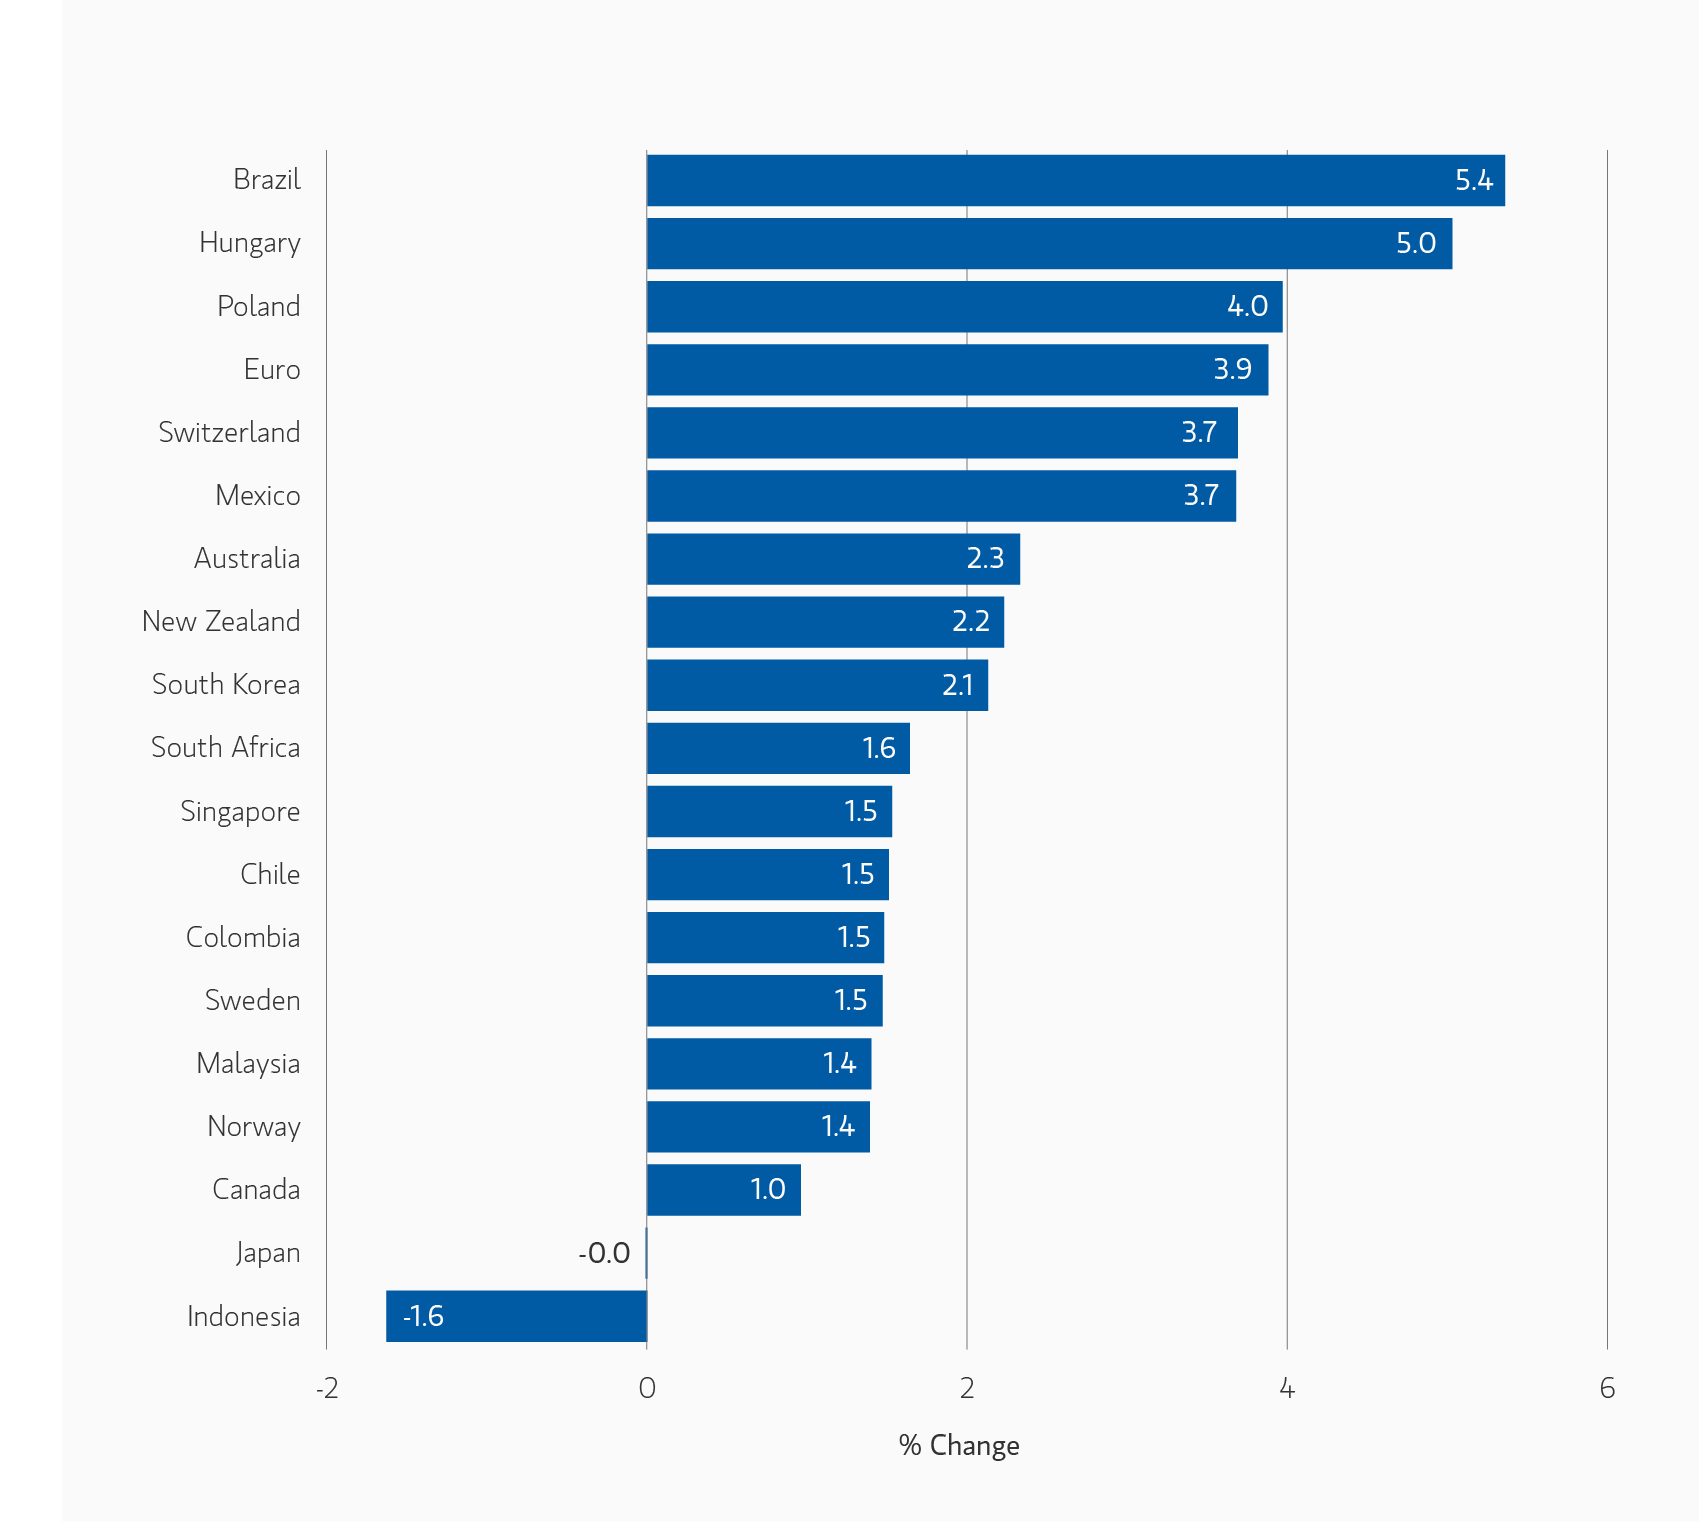
Currency Monthly Changes versus USD

DISPLAY 2
insight_wating-for-godot-fixed-income-edition_display-2.png

Note: Positive change means appreciation of the currency against the USD. Source: Bloomberg. Data as June 30, 2025.

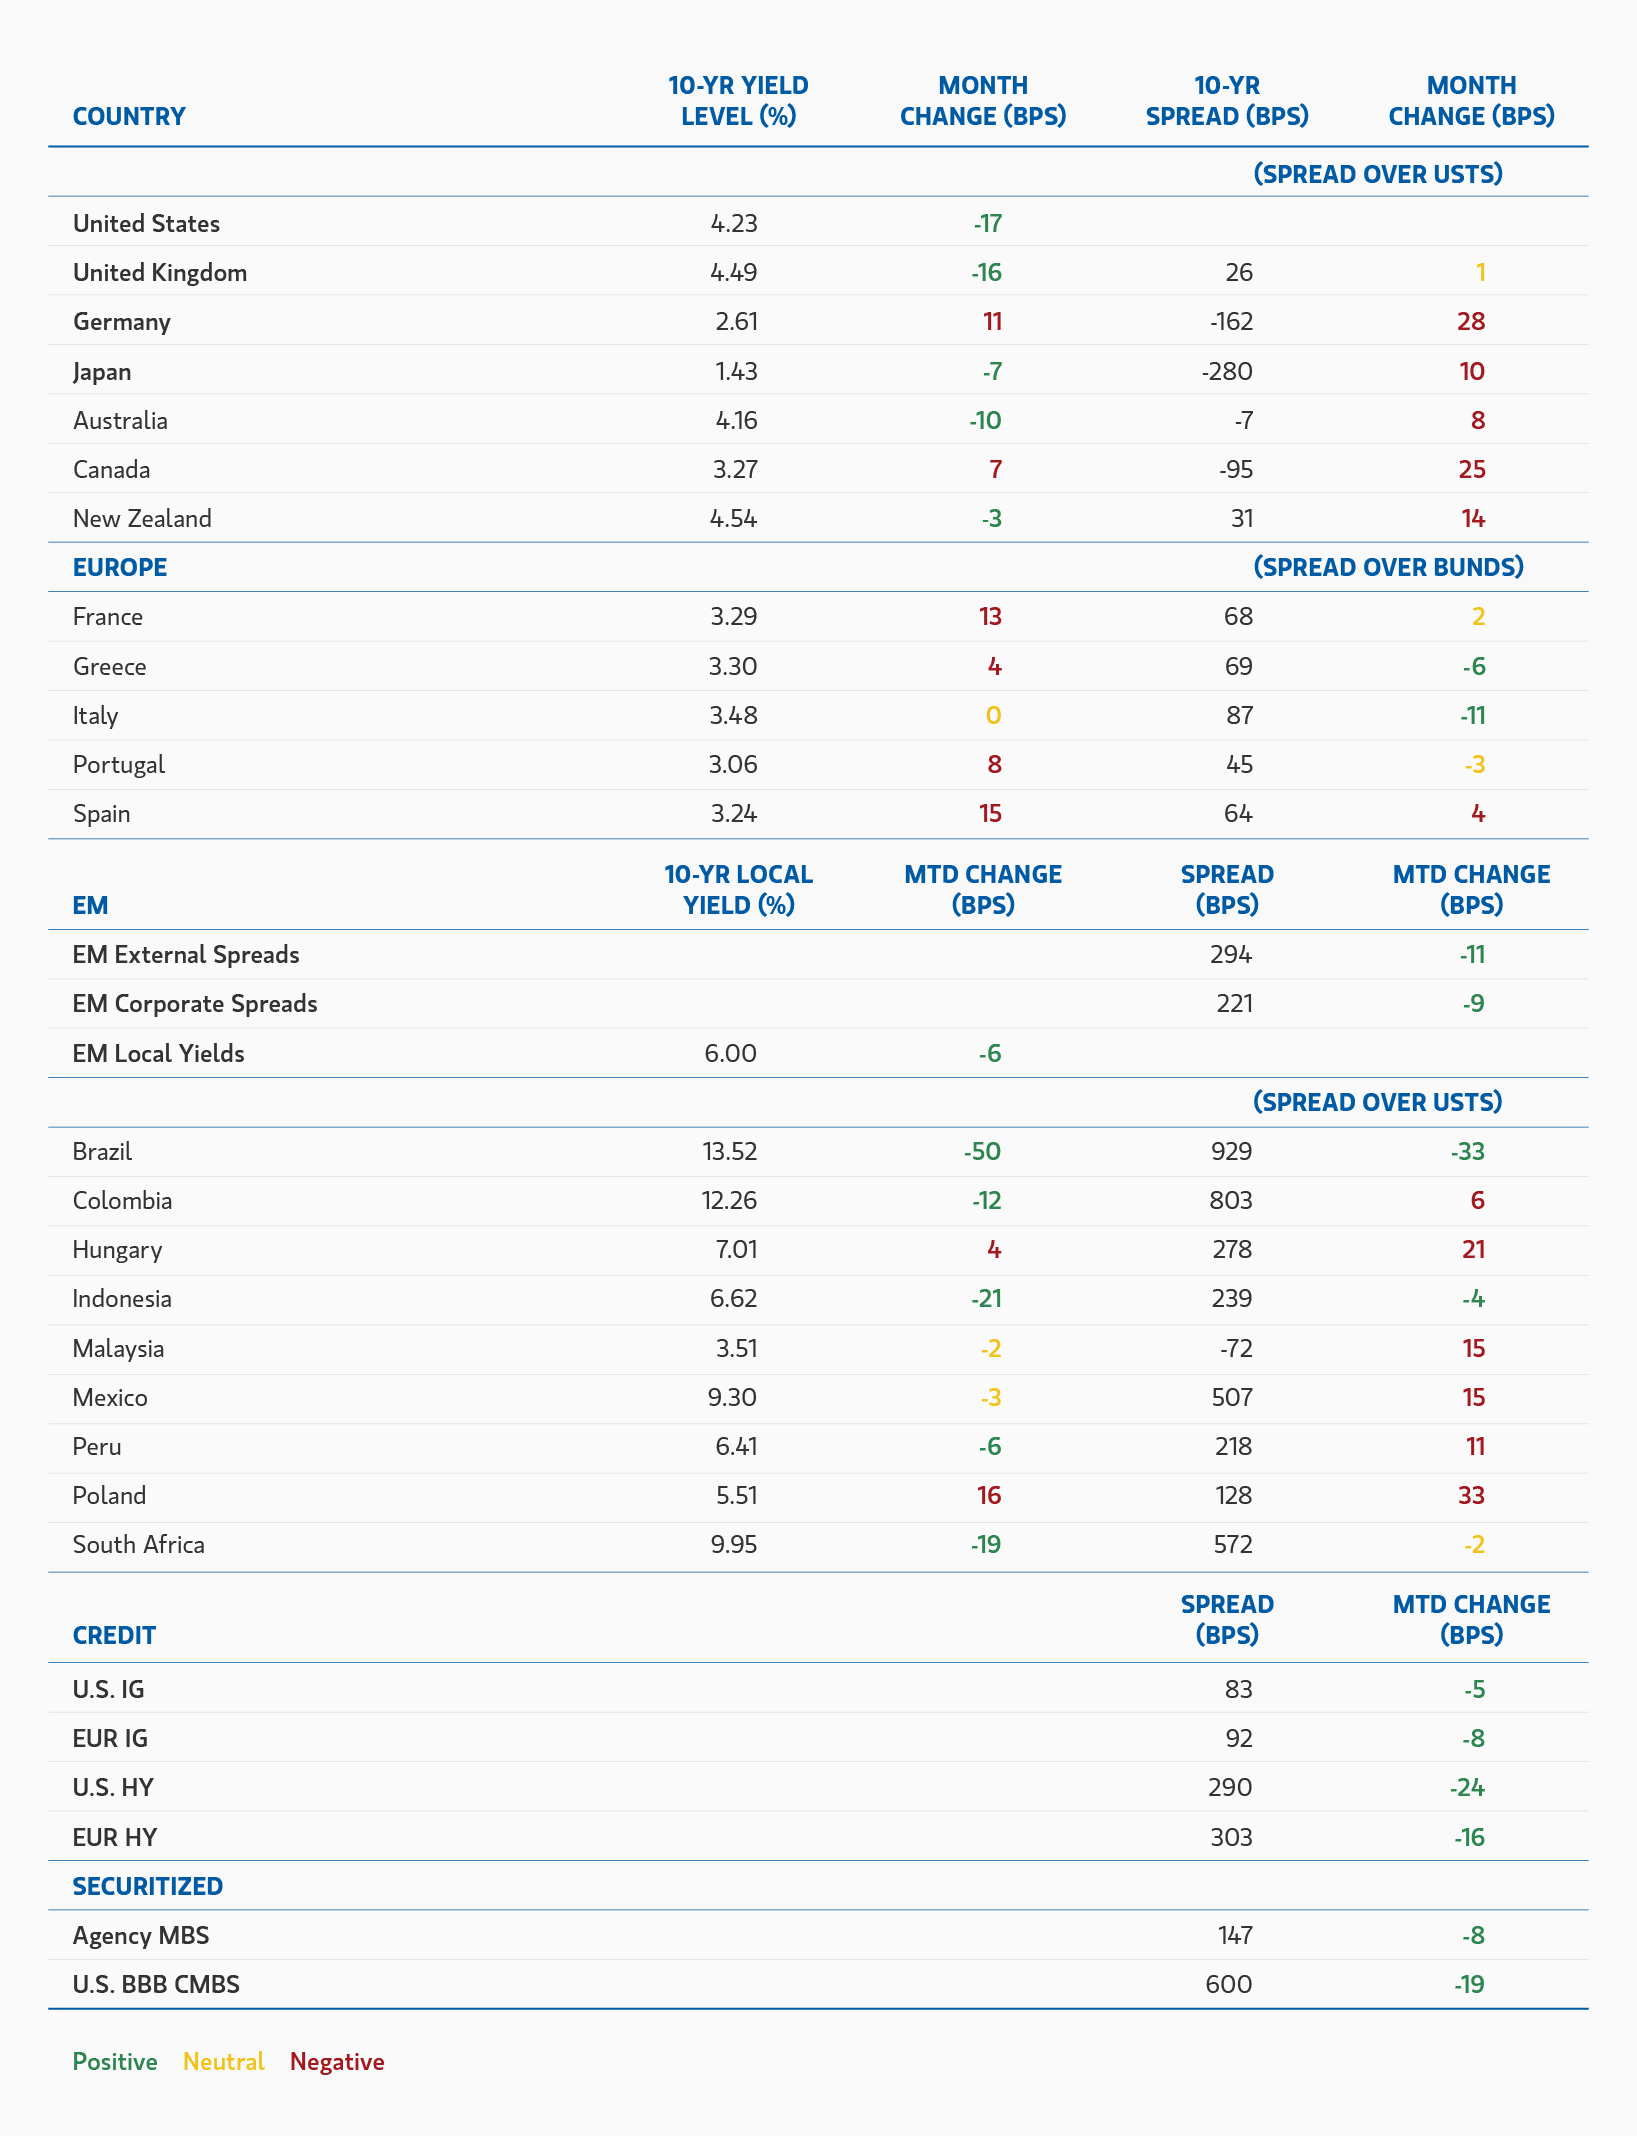
Major Monthly Changes in 10-Year Yields and Spreads

DISPLAY 3
insight_wating-for-godot-fixed-income-edition_display-3.png

Source: Bloomberg, JPMorgan. Data as of June 30, 2025.

Fixed Income Outlook
Since the Fed began its rate-cutting cycle with a 50-bp bang last September, things have gotten oddly quiet—at least when it comes to short-term rates. It’s now been six months since the last 25 bp cut, and short-maturity yields have barely budged. Compared to the rollercoaster of 2022 through 2024, the current trading range feels almost serene.

Yes, the yield curve has steepened since that first cut. The 2s10s curve has gone from flat to modestly positive. But let’s keep it in perspective: we’re still only a bit above half the average steepness seen over the past forty years. If this setup feels familiar, it might be because it echoes the five-year stretch between the spring of 1995 and the peak of the tech bubble in early 2000. Back then, the Fed wrapped up a hiking cycle and spent the next several years gently nudging rates up and down within a 125-bp range in response to macroeconomic developments.

For now, the next Fed cut remains elusive—much like Beckett’s Godot. Core PCE, the Fed’s preferred inflation gauge, is stuck at 2.7%, exactly where it was last September. The unemployment rate, at 4.2%, is only marginally higher. Add in the delayed impact of tariffs and the likelihood that stricter immigration policy will tighten labor markets, and it’s a bit puzzling that the front end of the U.S. bond market is now pricing in as many as three 25 bp cuts by year-end—up from an already questionable two at the start of June. Looking further out, the market is forecasting five cuts by the end of next year.

Outside the U.S., rate cycles appear to be nearing their end. Markets have priced in just one more cut for the ECB and the Bank of Canada, and about one and a bit for the Riksbank. Only in the higher-yielding markets—the UK and Australia—do we still see expectations for three or more cuts. Meanwhile, the Bank of Japan is heading in the opposite direction. With realized inflation still above 3% year-over-year and wage growth remaining elevated, policy rates may finally rise meaningfully above zero. That said, the market still expects the policy rate to remain below 1% two years from now.

Rather than trying to trade central banks, we continue to believe the safer bet is to position for steepening at the long end of the yield curve—not just in the U.S., but in Europe as well. Japan and the UK have already seen sharp steepening, which suggests that the historical support from insurers and pension funds at the long end of the curve can no longer be taken for granted. In our view, steeper curves reflect the market’s ongoing concern about persistently large deficits and the challenge of absorbing government bond supply in parts of the curve where natural buyers—those matching long-dated liabilities—are becoming increasingly scarce.

June brought more of the same: a continuation of the post-Liberation Day decline in volatility, despite headlines around Iran and Israel and the legislative horse-trading over the “One Big Beautiful Bill Act.” Credit spreads tightened through pre-Liberation Day levels, and equity markets pushed above their March highs. Despite what many would consider tight monetary policy—with the Fed Funds target rate still 200 bps above CPI, another echo of the mid-1990s—the market remains bullish on the economy.

In the Eurozone, sovereign spreads are now at their tightest levels since before the euro sovereign crisis. In many cases, this tightening is fundamentally justified: most countries are on ratings upgrade trajectories, and their fiscal dynamics are the best they’ve been in over a decade. That said, it’s not a universal story. France and Belgium have both been downgraded over the past year. Still, OAT-Bund spreads are at their tightest in the last 12 months, and while France is now one of the higher-yielding euro sovereigns, it’s hard to argue that the market is truly worried about French fiscal risk.

The one major difference between now and 1995? The dollar. When Robert Rubin became Treasury Secretary under President Clinton, he famously declared that “a strong dollar is in our national interest”—and backed it up with action. That commitment outlasted his tenure, helped along by a federal budget surplus by 1998 and a roughly balanced net international investment position.

Today’s backdrop couldn’t be more different. Both the budget and current account are deep in deficit, and the gap between what foreigners own in U.S. assets and what Americans own abroad now exceeds 80% of U.S. GDP. We believe foreign investors—already large holders of Treasuries and U.S. equities—may begin demanding a higher premium to fund these imbalances. That premium, in our view, implies a weaker dollar. We’re positioned accordingly: short the dollar against a basket of developed and emerging market currencies.

Developed Market Rate/Foreign Currency

Monthly Review
Developed market interest rates rose in the first half of June, before falling back to close lower on the month. 10y Treasury yields fell 17 bps to 4.23%, and 10y government bond yields were also lower in the UK, Japan, Australia and New Zealand. However. 10y Bund yields rose 10 bps to 2.6%, driven by more hawkish than expected ECB meeting in early June and better than expected growth data. Risk markets continued to recover ahead of the early-July deadline for tariff negotiations, with the S&P breaching 6,200 to reach a fresh all-time high at the end of June. In general, U.S. economic data was encouraging and pointed to a minimal impact on prices from tariffs, a still-resilient labour market, and a stabilisation in inflation expectations. The jobs report for May suggested the economy added 139,000 jobs over the month – slightly more than expected by the market. Meanwhile, core CPI printed below market expectations for the fourth consecutive time, consistent with a broader global theme of weaker inflation. Prices in various goods categories showed that firms, at least while drawing down on inventories, were not passing costs onto consumers in a significant way. During the latter half of the month, a number of policymakers from the Fed signalled they might be open to a rate cut at the July meeting. The market now discounts around two-and-a-half cuts by year-end and a one-in-five likelihood of the FOMC resuming its easing cycle in July.

In the Eurozone, the ECB delivered a 25-bp rate cut but suggested they were ambivalent about easing policy much further. After initially flattening, the curve continued to steepen, led by the long-end, as Germany announced a larger-than-expected increase in issuance, as well as an earlier increase in fiscal outlays. News reports suggest the European Union is considering accepting a trade agreement with the U.S. that includes the 10% universal tariffs first introduced in April, with carve-outs for sectors including pharmaceuticals, semiconductors and aircraft.

Geopolitics was an additional source of volatility in June. The conflict between Israel and Iran escalated, leading to a brief but sharp rise in oil prices, amid fears of a closure of the Strait of Hormuz, or damage to energy infrastructure. However, the impact of the war on risk assets and bond markets was short-lived, given the rapid de-escalation in hostilities. Geopolitical volatility also pushed the U.S. dollar briefly higher in the middle of the month, but the Bloomberg dollar index eventually ended June 2.1% weaker. All G10 currencies barring the Japanese yen gained against the US dollar. High-yielding and cyclical currencies continued to outperform amid a positive risk environment.

Outlook
We remain overweight duration in DM markets, though recognise that the recent repricing of central bank rate paths – particularly in the U.S. – has made duration less attractive at current levels. We also acknowledge that the inflationary impact of tariffs may become more apparent only in the summer – something that might lead to fewer rate cuts being priced. We also retain our long-standing curve steepening exposures in U.S.Treasuries and Bunds, though in the latter market we have recently adjusted our exposures in favour of long-end steepening. In Japan, we remain underweight duration given a strong wage and inflation picture, which we think will lead to more hikes than the market currently prices. We also hold onto our inflation breakeven positions. We are short the U.S. dollar against a basket of currencies.

Emerging Market Rate/Foreign Currency

Monthly Review
Performance was strong for EMD markets as EM currencies broadly strengthened against the backdrop of a weakening USD and EM rates outperformed global rates. Spreads tightened for sovereign and corporate credit. Israel launched an attack on Iran on June 13 targeting nuclear facilities and military sites. Iran retaliated with attacks on Israel, and the conflict escalated further with U.S. airstrikes on Iran nuclear facilities. A ceasefire between Israel and Iran was agreed to 12 days after the conflict started and has held. In South Korea, the first Presidential election since former President Yoon Suk Yeol enacted martial law in December and was impeached occurred. Newly elected President Lee is part of the left-wing party, but he is not an established member of the party. One of his primary initiatives is to revive the Korean stock market, which generally trades at a discount. Asset class flows were positive for both hard and local currency fund with $2.1B for hard currency and $1.9B for local currency funds.1

Outlook
The U.S. Fed held rates at its June meeting despite pressure from the U.S. administration. Ahead of the spring IMF meetings, global growth expectations was revised down significantly based on the April 2 tariff announcements. Uncertainty lingers amid the 90-day pause and active negotiations continue at the individual country level. The level of impact that U.S. tariff policy could have on inflation remains uncertain, but global tariffs are translating to a deflationary event outside of the U.S. Negative demand shocks and excess supplies with need to be rerouted and this will likely put negative pressure on prices. Technicals are likely to be supportive for the asset class as investors are starting to show increased interest in both local and hard currency funds. Individual country selection, a focus on fundamentals, and the direction of change will continue to be critical to elevate the asset class.

Corporate Credit

Monthly Review
Risk assets rallied in June, supported by resilient data, a Middle East ceasefire, Section 899 removal, and strong technicals, with EUR IG outperforming U.S. IG. US-China trade talks yielded a tariff framework, while Germany’s budget plans boosted growth expectations. Central banks struck a cautious tone: the ECB cut rates but signalled a pause, the Fed stayed on hold with a hawkish tilt, and the BoE maintained its stance. Eurozone PMIs were flat, with German strength offset by softness elsewhere; U.S. data was mixed, with weak ISMs but solid NFP and wages. Inflation softened in the U.S. and Eurozone, with limited tariff impact so far. Technicals remained strong, with strong June issuance and robust demand.

Performance in the U.S. and global high yield markets grew even stronger in June amid a meaningful drop in Treasury yields and a deep bid for risk, with the S&P 500 closing the quarter at record a new record high. The market showed little reaction to armed conflict with Iran, though upon the ceasefire oil futures fell into the mid-$60s.2 Primary market volume again increased and was met with ample demand as investors’ concern over tariffs lessened and expectations for future rate decreases increased. Inflows into U.S. high yield retail funds remained strong and, when added to May’s inflow, were to sufficient to erase the extreme outflows experienced in April. Meanwhile, default activity continued its modest climb.3

Global convertible bonds performed well along with other risk assets in June despite geopolitical tensions rising in the Middle East. Returns in the asset class were again led by higher beta and higher delta issuers as global equities continued their march higher. Ultimately, global convertible bonds underperformed global equities, but outperformed global bonds during the month. June has historically been a strong month for new issuance and this past month was no exception. In total, $26.1 billion priced in June surpassing May’s total of $18.7 billion, which, at the time, was the largest monthly issuance total since March 2021. Issuance by region was led by the U.S., which accounted for approximately two thirds of the new issuance during the month.  Year-to-date supply ended the month at $70.5 billion, which ahead of the $60.5 billion in new issuance over the same time period in 2024.4

Outlook
We remain cautiously constructive on credit, expecting low growth without a significant rise in downgrade or default risk. European policy remains supportive, while the U.S. fiscal picture is more mixed. Corporate fundamentals are solid, with firms maintaining low-risk strategies. Technicals are favourable, with manageable issuance and strong demand for IG yields. Looking ahead, we expect spreads to trade with some beta to trade headlines but do not expect a material change in the base case outlined above. At current levels spreads appear close to fair value so carry should be the main driver of return, though additional gains coming from sector and security selection are likely. Given the uncertain medium term fundamental backdrop, we have less confidence in material spread tightening, therefore we are a small long in spread duration with plenty capacity to add on weakness.

We begin the second half of 2025 with a cautious outlook. Peak risk and volatility emanating from evolving tariff and trade policy is likely behind us; however, the ultimate framework of international trade with the U.S. remains unclear. We expect the new framework will continue to impede economic growth and will act in concert with the “One Big Beautiful Bill” to stimulate higher, and stickier, inflation as the federal deficit under the current Bill would continue to balloon. Yields remain historically attractive, but the average spread in the high yield market, while approximately 50 bps above post-Global Financial Crisis (GFC) lows, reached in January, finished the second quarter below where it began the year and is susceptible to widening. We come to this conclusion after a thorough analysis of factors including U.S. and global economic growth, the evolving monetary policy of global central banks, consumer health, the fundamentals of high yield issuers, technical conditions, and valuations. Ultimately, while we believe the likelihood of a recession this year is low, we believe that caution is warranted and expect additional bouts of volatility in the months ahead.

We continue to remain constructive on the fundamentals of the global convertible bond market as we enter the second half of the year. Convertible bonds continue to exhibit their asymmetric profiles of reasonably balanced deltas and strong bond floors. Peak risk and volatility emanating from evolving tariff and trade policy is likely behind us; however, the ultimate framework of international trade with the U.S. remains unclear. Additionally, tensions in the Middle East seemed to have cooled, but time is needed to see if the ceasefire can hold over the medium-to-long term. The asset class’s bond floor feature will be particularly important if we see another uptick in volatility like we did in the second quarter. Despite being constructive on the fundamentals, we are cautious on the primary market, which is on pace to exceed 2024’s totals. While a majority of issuers continue to tap the market to refinance maturing debt in a relatively high-interest rate environment, the crypto-linked issuance trend that began at the end of 2024 has continued to accelerate this year, with more companies issuing debt to buy cryptocurrency. We believe this warrants caution, but also creates opportunity for a well-resourced investment teams focused on bottoms-up fundamental research.

Securitized Products

Monthly Review
Securitized credit markets experienced modest tightening in June, broadly in line with other fixed income sectors. However, agency MBS spreads tightened more meaningfully, having lagged in prior months. The U.S. Treasury curve bull steepened as softer inflation data revived expectations for Fed easing. Markets now price in two rate cuts for 2025—down from four in April—with the first expected in September.

Agency MBS spreads tightened by 8 bps to +147 bps over comparable Treasuries, remaining wide both historically and relative to other core fixed income sectors. The Fed’s MBS holdings declined by $17 billion to $2.13 trillion, now down $564 billion from their 2022 peak. U.S. banks modestly increased their MBS holdings to $2.682 trillion, a trend we expect to continue as SLR constraints ease and short-term rates decline. Money managers remained active buyers, drawn by attractive valuations.

June issuance remained strong across securitized sectors and was well absorbed. ABS issuance totaled $33.2 billion, in line with May. Non-agency CMBS issuance reached $11.8 billion, bringing 2025 YTD volumes to 56% above last year. Non-agency RMBS issuance rose 17% to $14.8 billion.5 Despite higher mortgage rates, residential credit fundamentals remained solid, supported by strong homeowner equity, low unemployment, and limited refinancing activity. Non-agency RMBS and ABS spreads tightened by 5–10 bps, while CMBS spreads narrowed by 10–20 bps. Within CMBS, high-end apartments, logistics, and luxury hotels continued to perform well, while Class B office remained under pressure.

Outlook
We expect agency MBS spreads to continue tightening in the second half of the year, supported by inflows from relative value investors and banks seeking attractive return profiles versus other core fixed income sectors and cash alternatives. However, we believe meaningful spread compression will likely require the Fed to begin cutting rates—something we anticipate later this year. Credit securitized spreads are likely to remain range-bound in the near term as markets await clarity on the economic impact of evolving tariff policies and further tightening in agency MBS spreads. Year-to-date, agency MBS has been one of the top-performing sectors, with securitized credit also delivering solid returns. As we enter July, we expect returns to be primarily driven by carry, supported by attractive yield levels. That said, current rate levels continue to strain household balance sheets, particularly among lower-income consumers. We expect continued stress in certain consumer ABS segments. Commercial real estate also remains challenged by elevated financing costs. In contrast, we maintain a constructive view on residential mortgage credit, which remains our preferred sector and the one area where we are comfortable extending down the credit spectrum. We remain more cautious on lower-rated ABS and CMBS. We continue to see strong relative value in agency MBS, especially when compared to investment-grade corporate spreads and historical agency MBS levels.


1 Source: JP Morgan as of June 30, 2025
2 Source: Bloomberg as of June 30, 2025
3 Source: JP Morgan as of June 30, 2025
4 Source: Bank of America as of June 30, 2025
5 Bloomberg as of June 30, 2025

Broad Markets Fixed Income Team

The Broad Markets Fixed Income team unites the expertise of single-sector research and trading teams across the Morgan Stanley Investment Management fixed income platform to identify what they believe are the best opportunities in fixed income.

RISK CONSIDERATIONS

Diversification neither assures a profit nor guarantees against loss in a declining market.

There is no assurance that a portfolio will achieve its investment objective. Portfolios are subject to market risk, which is the possibility that the market values of securities owned by the portfolio will decline and that the value of portfolio shares may therefore be less than what you paid for them. Market values can change daily due to economic and other events (e.g., natural disasters, health crises, terrorism, conflicts, and social unrest) that affect markets, countries, companies, or governments. It is difficult to predict the timing, duration, and potential adverse effects (e.g., portfolio liquidity) of events. Accordingly, you can lose money investing in a portfolio. Fixed-income securities are subject to the ability of an issuer to make timely principal and interest payments (credit risk), changes in interest rates (interest rate risk), the creditworthiness of the issuer and general market liquidity (market risk). In a rising interest-rate environment, bond prices may fall and may result in periods of volatility and increased portfolio redemptions. In a declining interest-rate environment, the portfolio may generate less income. Longer-term securities may be more sensitive to interest rate changes. Certain U.S. government securities purchased by the strategy, such as those issued by Fannie Mae and Freddie Mac, are not backed by the full faith and credit of the U.S. It is possible that these issuers will not have the funds to meet their payment obligations in the future. Public bank loans are subject to liquidity risk and the credit risks of lower-rated securities. High-yield securities (junk bonds) are lower-rated securities that may have a higher degree of credit and liquidity risk. Sovereign debt securities are subject to default risk. Mortgage- and asset-backed securities are sensitive to early prepayment risk and a higher risk of default and may be hard to value and difficult to sell (liquidity risk). They are also subject to credit, market, and interest rate risks. The currency market is highly volatile. Prices in these markets are influenced by, among other things, changing supply and demand for a particular currency; trade; fiscal, money and domestic or foreign exchange control programs and policies; and changes in domestic and foreign interest rates. Investments in foreign markets entail special risks such as currency, political, economic and market risks. The risks of investing in emerging market countries are greater than the risks generally associated with foreign investments. Derivative instruments may disproportionately increase losses and have a significant impact on performance. They also may be subject to counterparty, liquidity, valuation, and correlation and market risks. Restricted and illiquid securities may be more difficult to sell and value than publicly traded securities (liquidity risk). Due to the possibility that prepayments will alter the cash flows on collateralized mortgage obligations (CMOs), it is not possible to determine in advance their final maturity date or average life. In addition, if the collateral securing the CMOs or any third-party guarantees are insufficient to make payments, the portfolio could sustain a loss.

DEFINITIONS

Basis point (bp): One basis point = 0.01%.

INDEX DEFINITIONS

The indexes shown in this report are not meant to depict the performance of any specific investment, and the indexes shown do not include any expenses, fees, or sales charges, which would lower performance. The indexes shown are unmanaged and should not be considered an investment. It is not possible to invest directly in an index.

“Bloomberg®” and the Bloomberg Index/Indices used are service marks of Bloomberg Finance L.P. and its affiliates and have been licensed for use for certain purposes by Morgan Stanley Investment Management (MSIM). Bloomberg is not affiliated with MSIM, does not approve, endorse, review, or recommend any product, and. does not guarantee the timeliness, accurateness, or completeness of any data or information relating to any product.

The Bloomberg Euro Aggregate Corporate Index (Bloomberg Euro IG Corporate) is an index designed to reflect the performance of the euro-denominated investment-grade corporate bond market.

The Bloomberg Global Aggregate Corporate Index is the corporate component of the Bloomberg Global Aggregate index, which provides a broad-based measure of the global investment-grade fixed income markets.

The Bloomberg US Corporate High Yield Index measures the market of USD-denominated, non-investment grade, fixed-rate, taxable corporate bonds. Securities are classified as high yield if the middle rating of Moody’s, Fitch, and S&P is Ba1/BB+/BB+ or below. The index excludes emerging market debt.

The Bloomberg US Corporate Index is a broad-based benchmark that measures the investment grade, fixed-rate, taxable, corporate bond market.

The Bloomberg US Mortgage-Backed Securities (MBS) Index tracks agency mortgage-backed pass-through securities (both fixed-rate and hybrid ARM) guaranteed by Ginnie Mae (GNMA), Fannie Mae (FNMA) and Freddie Mac (FHLMC). The index is constructed by grouping individual TBA-deliverable MBS pools into aggregates or generics based on program, coupon, and vintage. Introduced in 1985, the GNMA, FHLMC and FNMA fixed-rate indexes for 30- and 15-year securities were backdated to January 1976, May 1977, and November 1982, respectively. In April 2007, agency hybrid adjustable-rate mortgage (ARM) pass-through securities were added to the index.

Consumer Price Index (CPI) is a measure that examines the weighted average of prices of a basket of consumer goods and services, such as transportation, food, and medical care.

Euro vs. USD—Euro total return versus U.S. dollar.

German 10YR bonds—Germany Benchmark 10-Year Datastream Government Index; Japan 10YR government bonds —Japan Benchmark 10-Year Datastream Government Index; and 10YR US Treasury—US Benchmark 10-Year Datastream Government Index.

The ICE BofAML European Currency High-Yield Constrained Index (ICE BofAML Euro HY constrained) is designed to track the performance of euro- and British pound sterling-denominated below investment-grade corporate debt publicly issued in the Eurobond, sterling.

The ICE BofAML US Mortgage-Backed Securities (ICE BofAML US Mortgage Master) Index tracks the performance of US dollar-denominated, fixed-rate and hybrid residential mortgage pass-through securities publicly issued by US agencies in the US domestic market.

The ICE BofAML US High Yield Master II Constrained Index (ICE BofAML US High Yield) is a market value-weighted index of all domestic and Yankee high-yield bonds, including deferred-interest bonds and payment-in-kind securities. Its securities have maturities of one year or more and a credit rating lower than BBB-/Baa3 but are not in default.

The ISM Manufacturing Index is based on surveys of more than 300 manufacturing firms by the Institute of Supply Management. The ISM Manufacturing Index monitors employment, production inventories, new orders, and supplier deliveries. A composite diffusion index is created that monitors conditions in national manufacturing based on the data from these surveys.

Italy 10-Year Government Bonds—Italy Benchmark 10-Year Datastream Government Index.

The JP Morgan CEMBI Broad Diversified Index is a global, liquid corporate emerging markets benchmark that tracks US-denominated corporate bonds issued by emerging markets entities.

The JPMorgan Government Bond Index—emerging markets (JPM local EM debt) tracks local currency bonds issued by emerging market governments. The index is positioned as the investable benchmark that includes only those countries that are accessible by most of the international investor base (excludes China and India as of September 2013).

The JPMorgan Government Bond Index Emerging Markets (JPM External EM Debt) tracks local currency bonds issued by emerging market governments. The index is positioned as the investable benchmark that includes only those countries that are accessible by most of the international investor base (excludes China and India as of September 2013).

The JP Morgan Emerging Markets Bond Index Global (EMBI Global) tracks total returns for traded external debt instruments in the emerging markets and is an expanded version of the EMBI+. As with the EMBI+, the EMBI Global includes US dollar-denominated Brady bonds, loans, and Eurobonds with an outstanding face value of at least $500 million.

The JP Morgan GBI-EM Global Diversified Index is a market-capitalization weighted, liquid global benchmark for US-dollar corporate emerging market bonds representing Asia, Latin America, Europe, and the Middle East/Africa.

JPY vs. USD—Japanese yen total return versus US dollar.

The Markit ITraxx Europe Index comprises 125 equally weighted credit default swaps on investment grade European corporate entities, distributed among 4 sub-indices: Financials (Senior & Subordinated), Non-Financials and HiVol.

The Nikkei 225 Index (Japan Nikkei 225) is a price-weighted index of Japan’s top 225 blue-chip companies on the Tokyo Stock Exchange.

The MSCI AC Asia ex-Japan Index (MSCI Asia ex-Japan) captures large- and mid-cap representation across two of three developed markets countries (excluding Japan) and eight emerging markets countries in Asia.

The MSCI All Country World Index (ACWI, MSCI global equities) is a free float-adjusted market capitalization weighted index designed to measure the equity market performance of developed and emerging markets. The term "free float" represents the portion of shares outstanding that are deemed to be available for purchase in the public equity markets by investors. The performance of the Index is listed in US dollars and assumes reinvestment of net dividends.

MSCI Emerging Markets Index (MSCI emerging equities) captures large- and mid-cap representation across 23 emerging markets (EM) countries.

The MSCI World Index (MSCI developed equities) captures large and mid-cap representation across 23 developed market (DM) countries.

Purchasing Managers Index (PMI) is an indicator of the economic health of the manufacturing sector.

The Refinitiv Convertible Global Focus USD Hedged Index is a market weighted index with a minimum size for inclusion of $500 million (US), 200 million (Europe), 22 billion Yen, and $275 million (Other) of Convertible Bonds with an Equity Link.

The Russell 2000® Index is an index that measures the performance of the 2,000 smallest companies in the Russell 3000 Index.

The S&P 500® Index (US S&P 500) measures the performance of the large-cap segment of the US equities market, covering approximately 75 percent of the US equities market. The index includes 500 leading companies in leading industries of the U.S. economy.

S&P CoreLogic Case-Shiller US National Home Price NSA Index seeks to measure the value of residential real estate in 20 major US metropolitan areas: Atlanta, Boston, Charlotte, Chicago, Cleveland, Dallas, Denver, Detroit, Las Vegas, Los Angeles, Miami, Minneapolis, New York, Phoenix, Portland, San Diego, San Francisco, Seattle, Tampa and Washington, D.C.

The S&P/LSTA US Leveraged Loan 100 Index (S&P/LSTA Leveraged Loan Index) is designed to reflect the performance of the largest facilities in the leveraged loan market.

The S&P GSCI Copper Index (Copper), a sub-index of the S&P GSCI, provides investors with a reliable and publicly available benchmark for investment performance in the copper commodity market.

The S&P GSCI Softs (GSCI soft commodities) Index is a sub-index of the S&P GSCI that measures the performance of only the soft commodities, weighted on a world production basis. In 2012, the S&P GSCI Softs Index included the following commodities: coffee, sugar, cocoa, and cotton.

Spain 10-Year Government Bonds—Spain Benchmark 10-Year Datastream Government Index.

The Thomson Reuters Convertible Global Focus USD Hedged Index is a market weighted index with a minimum size for inclusion of $500 million (US), 200 million euro (Europe), 22 billion yen, and $275 million (Other) of convertible bonds with an equity link.

U.K. 10YR government bonds—U.K. Benchmark 10-Year Datastream Government Index. For the following Datastream government bond indexes, benchmark indexes are based on single bonds. The bond chosen for each series is the most representative bond available for the given maturity band at each point in time. Benchmarks are selected according to the accepted conventions within each market. Generally, the benchmark bond is the latest issue within the given maturity band; consideration is also given to yield, liquidity, issue size and coupon.

The US Dollar Index (DXY) is an index of the value of the United States dollar relative to a basket of foreign currencies, often referred to as a basket of US trade partners’ currencies.

The Chicago Board Options Exchange (CBOE) Market Volatility (VIX) Index shows the market’s expectation of 30-day volatility.

There is no guarantee that any investment strategy will work under all market conditions, and each investor should evaluate their ability to invest for the long-term, especially during periods of downturn in the market.

A separately managed account may not be appropriate for all investors. Separate accounts managed according to the particular strategy may include securities that may not necessarily track the performance of a particular index. Please consider the investment objectives, risks and fees of the Strategy carefully before investing. A minimum asset level is required. For important information about the investment managers, please refer to Form ADV Part 2.

The views and opinions and/or analysis expressed are those of the author or the investment team as of the date of preparation of this material and are subject to change at any time without notice due to market or economic conditions and may not necessarily come to pass. Furthermore, the views will not be updated or otherwise revised to reflect information that subsequently becomes available or circumstances existing, or changes occurring, after the date of publication. The views expressed do not reflect the opinions of all investment personnel at Morgan Stanley Investment Management (MSIM) and its subsidiaries and affiliates (collectively “the Firm”) and may not be reflected in all the strategies and products that the Firm offers.

Forecasts and/or estimates provided herein are subject to change and may not actually come to pass. Information regarding expected market returns and market outlooks is based on the research, analysis and opinions of the authors or the investment team. These conclusions are speculative in nature, may not come to pass and are not intended to predict the future performance of any specific strategy or product the Firm offers. Future results may differ significantly depending on factors such as changes in securities or financial markets or general economic conditions.

This material has been prepared on the basis of publicly available information, internally developed data and other third-party sources believed to be reliable. However, no assurances are provided regarding the reliability of such information and the Firm has not sought to independently verify information taken from public and third-party sources.

This material is a general communication, which is not impartial, and all information provided has been prepared solely for informational and educational purposes and does not constitute an offer or a recommendation to buy or sell any particular security or to adopt any specific investment strategy. The information herein has not been based on a consideration of any individual investor circumstances and is not investment advice, nor should it be construed in any way as tax, accounting, legal or regulatory advice. To that end, investors should seek independent legal and financial advice, including advice as to tax consequences, before making any investment decision.

Charts and graphs provided herein are for illustrative purposes only. Past performance is no guarantee of future results.

The indexes are unmanaged and do not include any expenses, fees, or sales charges. It is not possible to invest directly in an index. Any index referred to herein is the intellectual property (including registered trademarks) of the applicable licensor. Any product based on an index is in no way sponsored, endorsed, sold, or promoted by the applicable licensor and it shall not have any liability with respect thereto.

This material is not a product of Morgan Stanley’s Research Department and should not be regarded as a research material or a recommendation.

The Firm has not authorized financial intermediaries to use and to distribute this material unless such use and distribution is made in accordance with applicable law and regulation. Additionally, financial intermediaries are required to satisfy themselves that the information in this material is appropriate for any person to whom they provide this material in view of that person’s circumstances and purpose. The Firm shall not be liable for, and accepts no liability for, the use or misuse of this material by any such financial intermediary.

This material may be translated into other languages. Where such a translation is made this English version remains definitive. If there are any discrepancies between the English version and any version of this material in another language, the English version shall prevail.

The whole or any part of this material may not be directly or indirectly reproduced, copied, modified, used to create a derivative work, performed, displayed, published, posted, licensed, framed, distributed, or transmitted or any of its contents disclosed to third parties without the Firm’s express written consent. This material may not be linked to unless such hyperlink is for personal and non-commercial use. All information contained herein is proprietary and is protected under copyright and other applicable law.

Eaton Vance is part of Morgan Stanley Investment Management. Morgan Stanley Investment Management is the asset management division of Morgan Stanley.

DISTRIBUTION

This material is only intended for and will only be distributed to persons resident in jurisdictions where such distribution or availability would not be contrary to local laws or regulations.

MSIM, the asset management division of Morgan Stanley (NYSE: MS), and its affiliates have arrangements in place to market each other’s products and services. Each MSIM affiliate is regulated as appropriate in the jurisdiction it operates. MSIM’s affiliates are: Eaton Vance Management (International) Limited, Eaton Vance Advisers International Ltd, Calvert Research and Management, Eaton Vance Management, Parametric Portfolio Associates LLC, and Atlanta Capital Management LLC.

This material has been issued by any one or more of the following entities:

EMEA:

This material is for Professional Clients/Accredited Investors only.

In the EU, MSIM and Eaton Vance materials are issued by MSIM Fund Management (Ireland) Limited (“FMIL”). FMIL is regulated by the Central Bank of Ireland and is incorporated in Ireland as a private company limited by shares with company registration number 616661 and has its registered address at 24-26 City Quay, Dublin 2, D02 NY 19, Ireland.

Outside the EU, MSIM materials are issued by Morgan Stanley Investment Management Limited (MSIM Ltd) is authorised and regulated by the Financial Conduct Authority. Registered in England. Registered No. 1981121. Registered Office: 25 Cabot Square, Canary Wharf, London E14 4QA.

In Switzerland, MSIM materials are issued by Morgan Stanley & Co. International plc, London (Zurich Branch) Authorised and regulated by the Eidgenössische Finanzmarktaufsicht ("FINMA"). Registered Office: Beethovenstrasse 33, 8002 Zurich, Switzerland.

Outside the US and EU, Eaton Vance materials are issued by Eaton Vance Management (International) Limited (“EVMI”) 125 Old Broad Street, London, EC2N 1AR, UK, which is authorised and regulated in the United Kingdom by the Financial Conduct Authority.

Italy: MSIM FMIL (Milan Branch), (Sede Secondaria di Milano) Palazzo Serbelloni Corso Venezia, 16 20121 Milano, Italy. The Netherlands: MSIM FMIL (Amsterdam Branch), Rembrandt Tower, 11th Floor Amstelplein 1 1096HA, Netherlands. France: MSIM FMIL (Paris Branch), 61 rue de Monceau 75008 Paris, France. Spain: MSIM FMIL (Madrid Branch), Calle Serrano 55, 28006, Madrid, Spain. Germany: Germany: MSIM FMIL (Frankfurt Branch), Grosse Gallusstrasse 18, 60312 Frankfurt am Main, Germany (Gattung: Zweigniederlassung (FDI) gem. § 53b KWG). Denmark: MSIM FMIL (Copenhagen Branch), Gorrissen Federspiel, Axel Towers, Axeltorv2, 1609 Copenhagen V, Denmark.

MIDDLE EAST

Dubai: MSIM Ltd (Representative Office, Unit Precinct 3-7th Floor-Unit 701 and 702, Level 7, Gate Precinct Building 3, Dubai International Financial Centre, Dubai, 506501, United Arab Emirates. Telephone: +97 (0)14 709 7158). This document is distributed in the Dubai International Financial Centre by Morgan Stanley Investment Management Limited (Representative Office), an entity regulated by the Dubai Financial Services Authority (“DFSA”). It is intended for use by professional clients and market counterparties only. This document is not intended for distribution to retail clients, and retail clients should not act upon the information contained in this document.

This document relates to a financial product which is not subject to any form of regulation or approval by the DFSA. The DFSA has no responsibility for reviewing or verifying any documents in connection with this financial product. Accordingly, the DFSA has not approved this document or any other associated documents nor taken any steps to verify the information set out in this document and has no responsibility for it. The financial product to which this document relates may be illiquid and/or subject to restrictions on its resale or transfer. Prospective purchasers should conduct their own due diligence on the financial product. If you do not understand the contents of this document, you should consult an authorized financial adviser.

US

NOT FDIC INSURED | OFFER NO BANK GUARANTEE | MAY LOSE VALUE | NOT INSURED BY ANY FEDERAL GOVERNMENT AGENCY | NOT A DEPOSIT

Latin America (Brazil, Chile Colombia, Mexico, Peru, and Uruguay)

This material is for use with an institutional investor or a qualified investor only. All information contained herein is confidential and is for the exclusive use and review of the intended addressee and may not be passed on to any third party. This material is provided for informational purposes only and does not constitute a public offering, solicitation, or recommendation to buy or sell for any product, service, security and/or strategy. A decision to invest should only be made after reading the strategy documentation and conducting in-depth and independent due diligence.

ASIA PACIFIC

Hong Kong: This material is disseminated by Morgan Stanley Asia Limited for use in Hong Kong and shall only be made available to “professional investors” as defined under the Securities and Futures Ordinance of Hong Kong (Cap 571). The contents of this material have not been reviewed nor approved by any regulatory authority including the Securities and Futures Commission in Hong Kong. Accordingly, save where an exemption is available under the relevant law, this material shall not be issued, circulated, distributed, directed at, or made available to, the public in Hong Kong. Singapore: This material is disseminated by Morgan Stanley Investment Management Company and may not be circulated or distributed, whether directly or indirectly, to persons in Singapore other than to (i) an accredited investor (ii) an expert investor or (iii) an institutional investor as defined in Section 4A of the Securities and Futures Act, Chapter 289 of Singapore (“SFA”); or (iv) otherwise pursuant to, and in accordance with the conditions of, any other applicable provision of the SFA. This publication has not been reviewed by the Monetary Authority of Singapore. Australia: This material is provided by Morgan Stanley Investment Management (Australia) Pty Ltd ABN 22122040037, AFSL No. 314182 and its affiliates and does not constitute an offer of interests. Morgan Stanley Investment Management (Australia) Pty Limited arranges for MSIM affiliates to provide financial services to Australian wholesale clients. Interests will only be offered in circumstances under which no disclosure is required under the Corporations Act 2001 (Cth) (the “Corporations Act”). Any offer of interests will not purport to be an offer of interests in circumstances under which disclosure is required under the Corporations Act and will only be made to persons who qualify as a “wholesale client” (as defined in the Corporations Act). This material will not be lodged with the Australian Securities and Investments Commission.

Japan:

For professional investors, this document is circulated or distributed for informational purposes only. For those who are not professional investors, this document is provided in relation to Morgan Stanley Investment Management (Japan) Co., Ltd. (“MSIMJ”)’s business with respect to discretionary investment management agreements (“IMA”) and investment advisory agreements (“IAA”). This is not for the purpose of a recommendation or solicitation of transactions or offers any particular financial instruments. Under an IMA, with respect to management of assets of a client, the client prescribes basic management policies in advance and commissions MSIMJ to make all investment decisions based on an analysis of the value, etc. of the securities, and MSIMJ accepts such commission. The client shall delegate to MSIMJ the authorities necessary for making investment. MSIMJ exercises the delegated authorities based on investment decisions of MSIMJ, and the client shall not make individual instructions. All investment profits and losses belong to the clients; principal is not guaranteed. Please consider the investment objectives and nature of risks before investing. As an investment advisory fee for an IAA or an IMA, the amount of assets subject to the contract multiplied by a certain rate (the upper limit is 2.20% per annum (including tax)) shall be incurred in proportion to the contract period. For some strategies, a contingency fee may be incurred in addition to the fee mentioned above. Indirect charges also may be incurred, such as brokerage commissions for incorporated securities. Since these charges and expenses are different depending on a contract and other factors, MSIMJ cannot present the rates, upper limits, etc. in advance. All clients should read the Documents Provided Prior to the Conclusion of a Contract carefully before executing an agreement. This document is disseminated in Japan by MSIMJ, Registered No. 410 (Director of Kanto Local Finance Bureau (Financial Instruments Firms)), Membership: The Japan Securities Dealers Association, the Investment Trusts Association, Japan, the Japan Investment Advisers Association, and the Type II Financial Instruments Firms Association.