


Steep Muni Yield Curve Highlights Potential Gains in 2026.
The story of the municipal bond market for 2025 was a tale of two distinctly different halves, especially for the long end of the yield curve. Longer-term munis underperformed significantly in the first half, but came roaring back in the second half. The pattern was reversed for the shorter end of the curve, as the first half of the year outpaced the second half. The good news is that we believe the muni market for 2026 is offering much the same potential for strong gains that attracted investors in the latter half of 2025.
The Muni Curve Remains Steep from a Historical Perspective: As the chart below shows, 20-year AA rated munis currently have a taxable-equivalent yield1 of just under 7% -- 171 basis points (bps) higher than the comparable 20-year AA corporate, and substantially above its own 10-year average.
A steep yield curve signals attractive muni yields at long end.
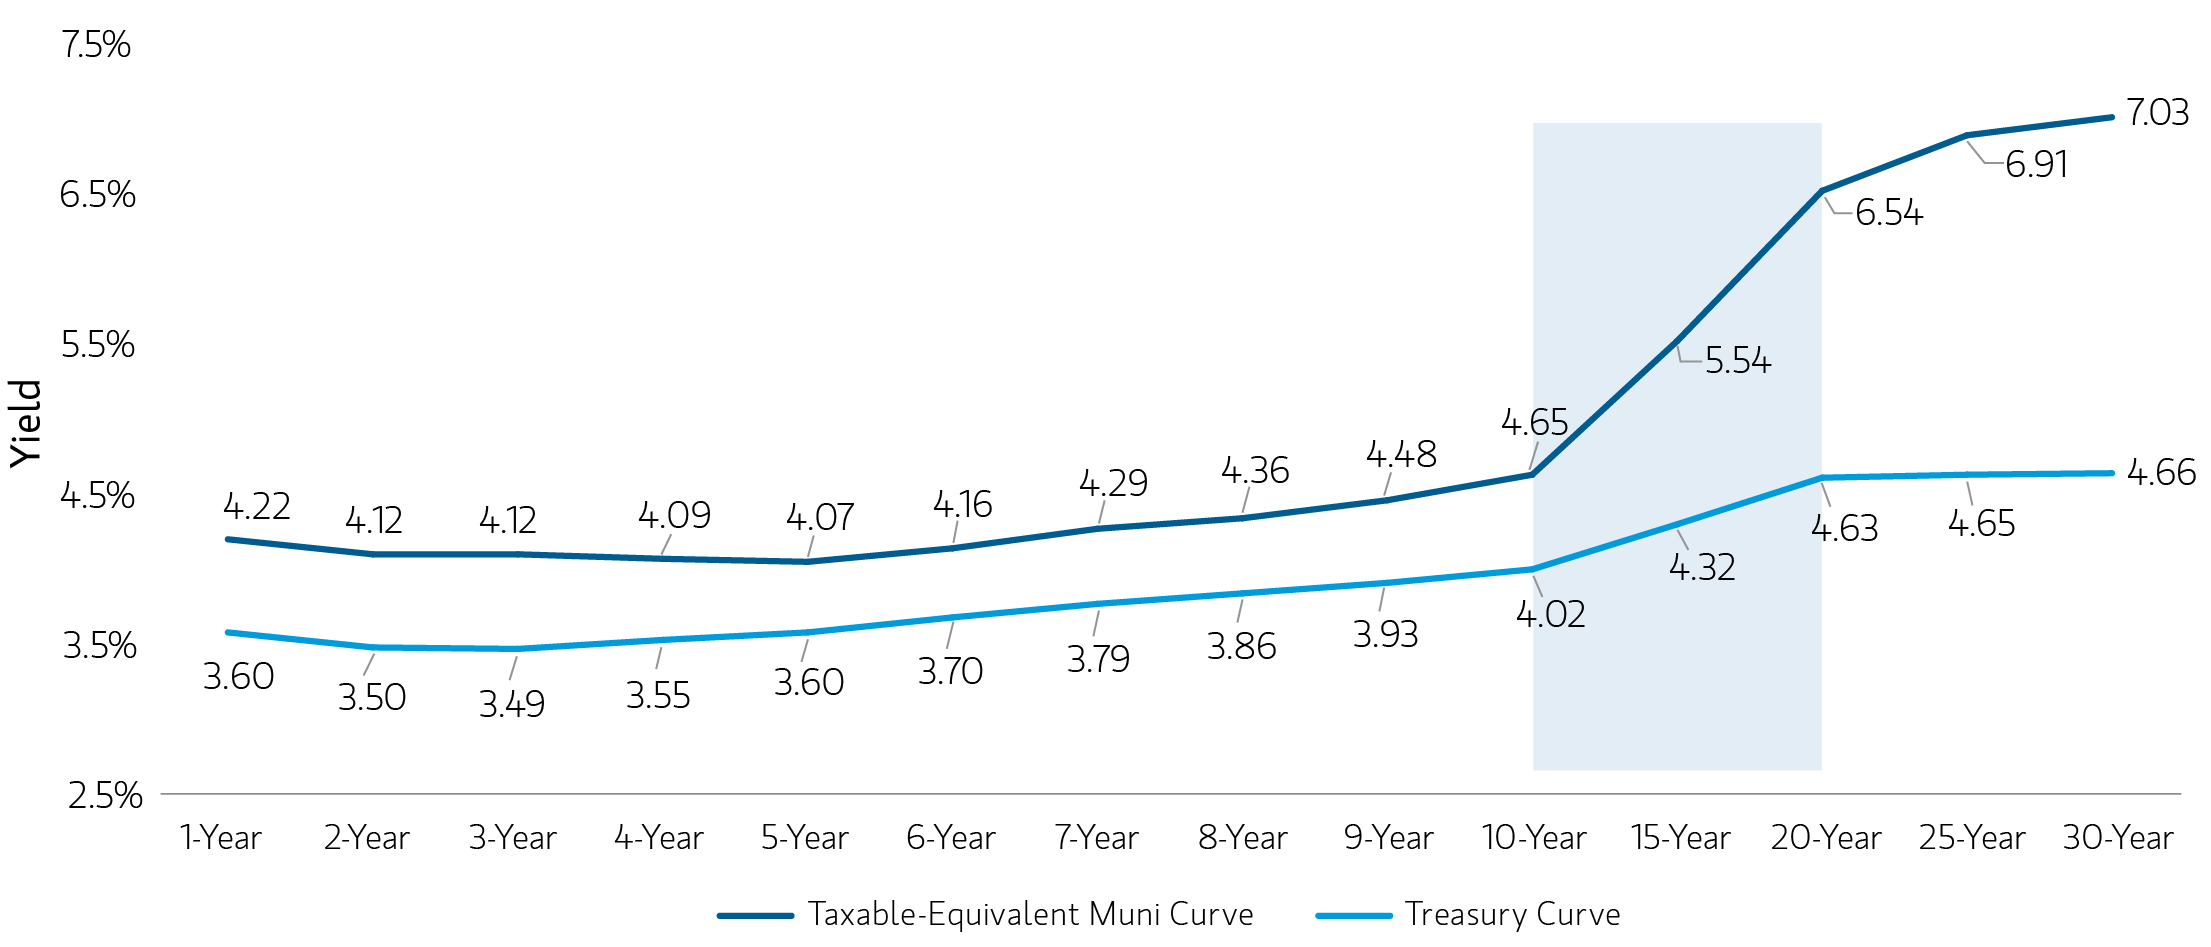
A steep yield curve signals attractive muni yields at long end.
Exhibit 1
Significant Headwinds from Washington in 2025 Should Dissipate in 2026. In 2025, bond investors had to contend with major headwinds from Washington that included tariff uncertainty and the federal government shutdown. The muni market endured an additional level of uncertainty in the first half of the year as the “One Big Beautiful Bill” Act threatened the municipal bond tax exemption. While the muni tax exemption was ultimately left untouched, a lot of issuance was pulled forward to the first half of the year to get ahead of any potential changes, resulting in a challenging technical environment and muni market underperformance. Predictions about policy-induced volatility are notoriously risky, and while we are anticipating record municipal issuance in 2026, we anticipate fewer disruptions along those lines for the year.
Fed Easing. For 2026, we forecast steady-to-improving economic performance supported by modest growth comparable to this year’s 1.75% increase in real GDP, with inflation reasonably contained near 2025’s yearend level of 3%. The new Fed Chair, whose first meeting will be in June, will likely be willing to let inflation run a little hotter in order to get rates closer to neutral by the end of 2026.
However, if the new Chair pushes for more than the two rate cuts priced into the market right now, persuading the rest of the FOMC could be a challenge. In this monetary policy environment, our base case entering 2026 is a steepening yield curve, with the short end falling while 10-year U.S. Treasurys trade in a range between 4.00% and 4.50%. However, we are closely watching the current opposing forces of potentially weaker employment and sticky inflation, which could move our base case should one factor become a more prominent driver of the economy as the year progresses.
Given the relatively benign policy and interest rate environment we foresee for 2026, the following are our thoughts on why munis now appear particularly attractive:
High After-Tax Yields. As chart 1 suggests, muni yields compare favorably to investment grade corporates. Chart 2 further illustrates how taxable equivalent muni yields1 eclipse all other major domestic bond sectors: first high-yield munis as they compare with their counterpart high-yield corporate bonds, and then the muni index with the corporate index, the U.S. Aggregate and U.S. Treasurys.
Muni yields surpass those in other bond sectors. Yield-to-Worst and Taxable-Equivalent Yields for Municipal Indexes
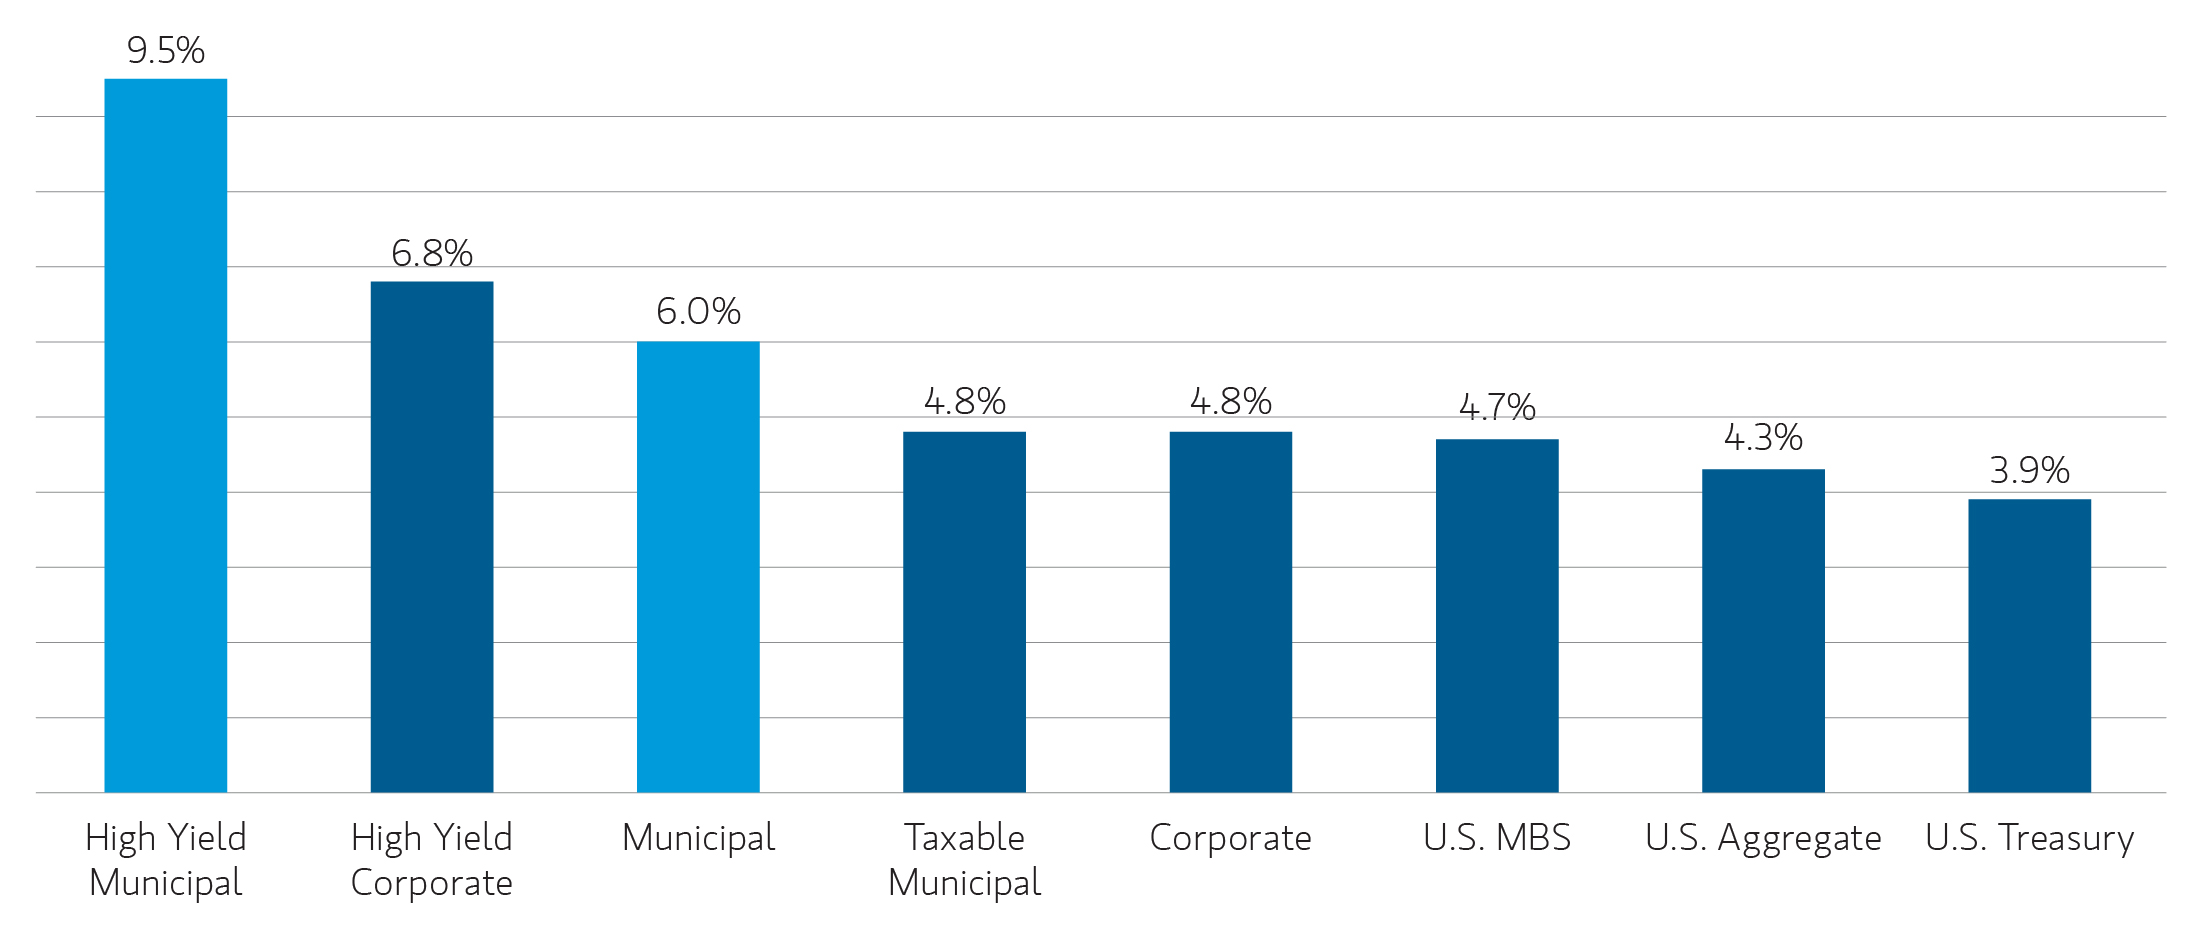
Muni yields surpass those in other bond sectors. Yield-to-Worst and Taxable-Equivalent Yields for Municipal Indexes
Exhibit 2
The high yields on munis stem from last year’s underperformance. As noted above, munis lost ground in the first half of 2025, and started to make that up in the second half, resulting in a 4.15% total return on the Bloomberg Municipal Bond Index for the year through November 30. While this lagged other bond sectors, it still handily outpaced the 10-year average annual return of 2.41% for the Index. Also, keep in mind that sectors that lag in one year often move up the ranks the following year, as investors look to overweight the relative underperforming sectors and underweight the outperformers.
On a Relative Value Basis Munis Are Attractive Compared to Other Asset Classes. Even though munis have made significant gains since their market value lows of last July, we believe that their momentum still has a way to go. The spread between the 5-year muni and 30-year on November 30 was 177 bps, 60 bp’s steeper than the ten year average. We believe this could still happen even if long Treasury rates creep up, given the differing supply and demand dynamics of the muni and U.S. Treasury markets,
This view is also supported by relative spreads. Longer maturity AAA rated Munis (20- and 30-year maturities) are slightly cheaper than Treasurys compared to the five-year average. Meanwhile when looking at the five-year average of AA Rated-Muni yields compared to AA Corporates, munis are cheap across the entire curve, except for in 10 years.
Solid Credit Picture. Municipal credit has strengthened significantly in recent years, as evidenced by the fact that S&P has upgraded more municipal credits than it has downgraded for 18 consecutive quarters. Municipal defaults have also remained low in recent years, and through November 30, only 41 municipal issuers have defaulted, compared with the full-year record low of 46 set in 2018. The Eaton Vance Municipal Research Team maintains sector outlooks on all of the major sectors across the municipal market. The Team currently rates 10 sectors with Stable outlooks, with just two sectors having Negative outlooks (Higher Education and Tobacco). Throughout 2026, we expect municipal credit to remain strong but expect weak links to emerge among smaller regional colleges, lower-rated regional hospitals, certain tobacco bonds and charter schools in competitive markets.
Diversification Potential. With equities trading near all-time highs, the role of fixed income in 2026 as a diversifier against equity volatility becomes especially important. Munis, with a correlation of just 0.222 to the S&P 500 Index, have historically been an effective portfolio diversifier, and are less correlated to equities than investment grade bonds (0.47) and corporate high-yield (0.74).
Risks to Forecast. Issuance in 2025 was closing in on a record $580 billion, as of November 30, and we anticipate a comparable level in 2026, thanks in large part to growing infrastructure costs. This potential amount of issuance could be a dampener on muni prices unless sufficient demand can absorb it.
However, we see sources of muni demand that could indeed increase significantly. For example, rates on money market funds – with $8 trillion under management – are falling below the important 4% threshold. Munis can offer an attractive alternative source of yield. And, as noted above, stock market volatility could attract muni investors seeking diversification.
At the policy level, any number of developments could rock the interest rate boat. If, for example, the Supreme Court acquiesces to President Trump’s desire to replace the entire Federal Reserve Board, the inflationary consequences could be significant. A Democrat sweep in November could inject new uncertainty into the markets. Recession risk could increase if the weakening in the labor market is greater than expected.
The Importance of Active Management
The competing forces in today’s environment -- between slowing employment, adequate economic growth and inflationary pressures -- make an active investment approach vital. Outperformance is driven by managers’ ability to pivot as new economic and technical data change investors’ sentiment. This outlook is a starting point for where to position as we start 2026 but markets and sentiment change throughout the year. This is especially true of the municipal market, with thousands of issuers whose bonds often lack the liquidity of other kinds of debt. We welcome the opportunity to help you maximize the value of a tax-exempt allocation in your portfolio.
Index definitions
Bloomberg High Yield Municipal Bond Index is an unmanaged index of non-Investment Grade Municipal bonds traded in the U.S.
Bloomberg U.S. Corporate High Yield Index is an unmanaged index consisting of domestic and corporate bonds rated Ba and below with a minimum outstanding amount of $150 million. You cannot invest directly in an index.
Bloomberg Municipal Bond Index is an unmanaged index of Municipal bonds traded in the U.S.
Bloomberg Taxable Municipal Bond Index is an unmanaged index of Taxable Municipal bonds traded in the U.S.
Bloomberg U.S. Corporate Investment Grade Index is an unmanaged index that measures the performance of investment-grade corporate securities within the Barclays U.S. Aggregate Index.
Bloomberg U.S. Aggregate Index is an unmanaged index of domestic investment-grade bonds, including corporate, government and mortgage-backed securities.
Bloomberg U.S. Mortgage-Backed Securities (MBS) Index measures agency mortgage-backed pass-through securities issued by GNMA, FNMA, and FHLMC.
Bloomberg U.S. Treasury Index measures public debt instruments issued by the U.S. Treasury, excluding short-term Treasury bills.
Bloomberg AA Municipal Curve is a benchmark showing yields for high-quality (AA-rated) U.S. general obligation municipal bonds, using data from the Bloomberg Valuation Service.
AA Corporate Curve refers to the yield curve for AA-rated investment-grade corporate bonds, showing yields across different maturities, based on data from Bloomberg, Refinitiv, and Morgan Stanley.
1 Tax-equivalent yield is provided for illustrative and educational purposes only and does not reflect the return or likely return of any actual investments. Tax-equivalent yield calculates the return needed on a taxable investment to make it equal the return on a tax-exempt investment and is commonly used when evaluating municipal bond returns against taxable bond returns. The tax-equivalent yield is calculated by dividing the municipal bond’s yield by (1-tax rate), which in this analysis is 40.8%, the highest federal income tax rate.
2 A correlation coefficient measures the strength and direction of a relationship between two investments. A coefficient of -1 indicates they move in exact opposite directions; +1 indicates they move in perfect lockstep, while 0 means there is no correlation. The lower the correlation of an investment with other portfolio investments, the greater its potential as a diversifer.
Featured Insights