Scroll Up Top
Print icon
Print

Over the last several years, credit spreads across a variety of fixed income sectors have tightened dramatically and are now trading near their most expensive valuations in years. For example, investment grade corporates, fueled by strong demand from absolute yield buyers, are now trading at their tightest spreads in nearly 30 years. Given the fact that the Bloomberg U.S. Aggregate Bond Index (“the Agg”) is predominantly comprised of Treasurys and investment grade (IG) corporate bonds, and considering the possibility of a limited amount of spread compression on the horizon at today’s valuations, investing in the Agg for more than coupon income seems akin to just betting on falling rates.

Looking beyond the Agg for yield, return & diversification1 potential
There may be a better option, and investors may benefit by looking beyond traditional core fixed income sectors and consider investing in the “plus sectors” of the global fixed income markets. Attractive opportunities may be found in sectors such as emerging markets (EM) debt, agency and non-agency residential mortgage-backed securities (RMBS) and high yield corporates, for example, which have historically offered attractive yields, competitive returns and diversification versus core fixed income markets with different levels of risk.

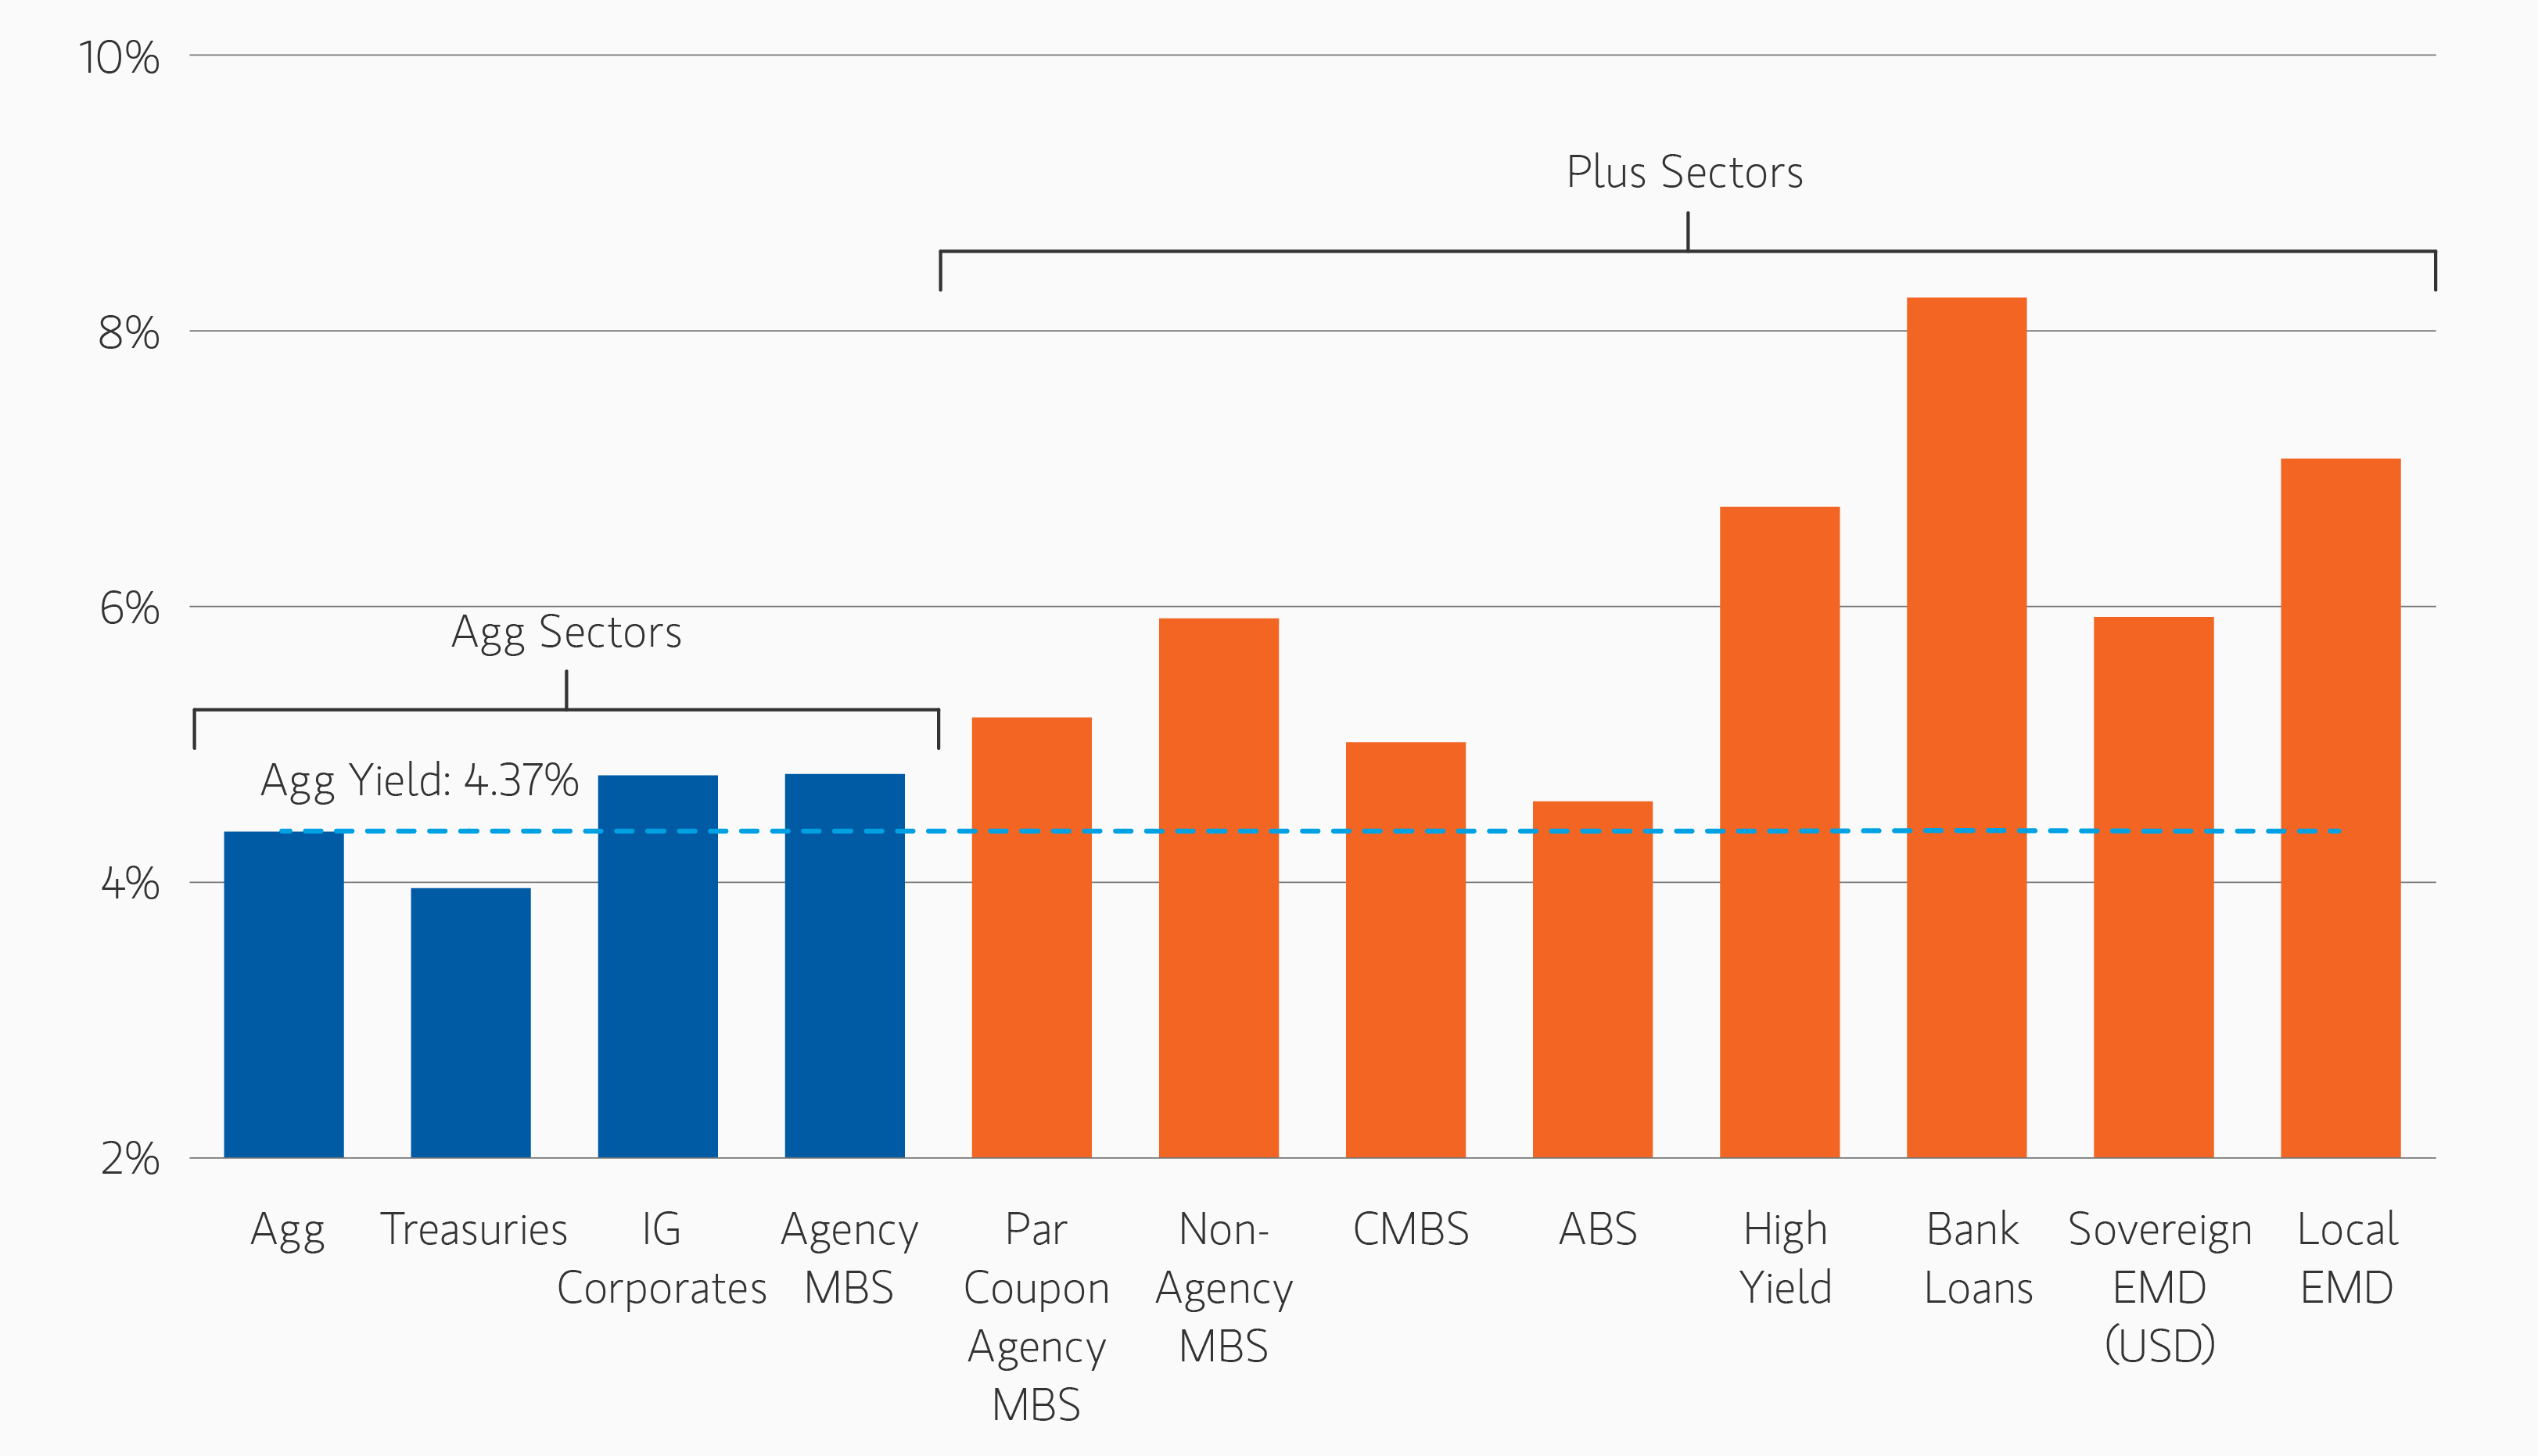
Yield-Worst: Agg Sectors vs. "Plus Sectors"

insight_invest-in-fixed-income-sectors_display1.png

Source:  Bloomberg, JPMorgan. As of 09/30/2025. Past performance is no guarantee of future results. The indexes shown are unmanaged and should not be considered an investment. It is not possible to invest directly in an index. The index performance is provided for illustrative purposes only and is not meant to depict the performance of a specific investment. Treasurys are backed by the full faith and credit of the US government if held to maturity. Not all government agency bonds are backed by the full faith and credit of the US government. In general, fixed income investments are subject to credit and interest rate risks. High yield investments may have a higher degree of credit and liquidity risk. Foreign securities are subject to currency, political, economic and market risks. The risks of investing in emerging market countries are greater than investments in foreign developed countries. Investors should carefully review the risks of each asset class prior to investing. For risks considerations of the fund, please refer to the risk considerations of the fund in the disclosure section. Indices: Treasuries: ICE BofA US Treasury Index,  IG Corporates: ICE BofA US Corporate Index, Agency MBS: ICE BofA US MBS Index, Par Coupon Agency MBS: ICE BofA US 30-Year Current Coupon UMBS Index, Non-Agency MBS: J.P. Morgan Non-Agency RMBS Credit Index, CMBS: ICE BofA US Fixed Rate CMBS Index, ABS: ICE BofA US Fixed Rate ABS Index, High Yield: ICE BofA US High Yield Index, Sovereign EMD: JPMorgan EMBI Global Diversified Index, Local EMD: JPMorgan GBI-EM Global Diversified Index

The challenge for many investors, however, is determining when and how much to invest in these "plus sectors", as it can be difficult to determine the appropriate time to increase EM debt exposure or to reduce floating-rate loan exposure, for example. To be sure, the average investor has generally mis-timed these allocation decisions, resulting in inferior investor returns compared to the category averages.

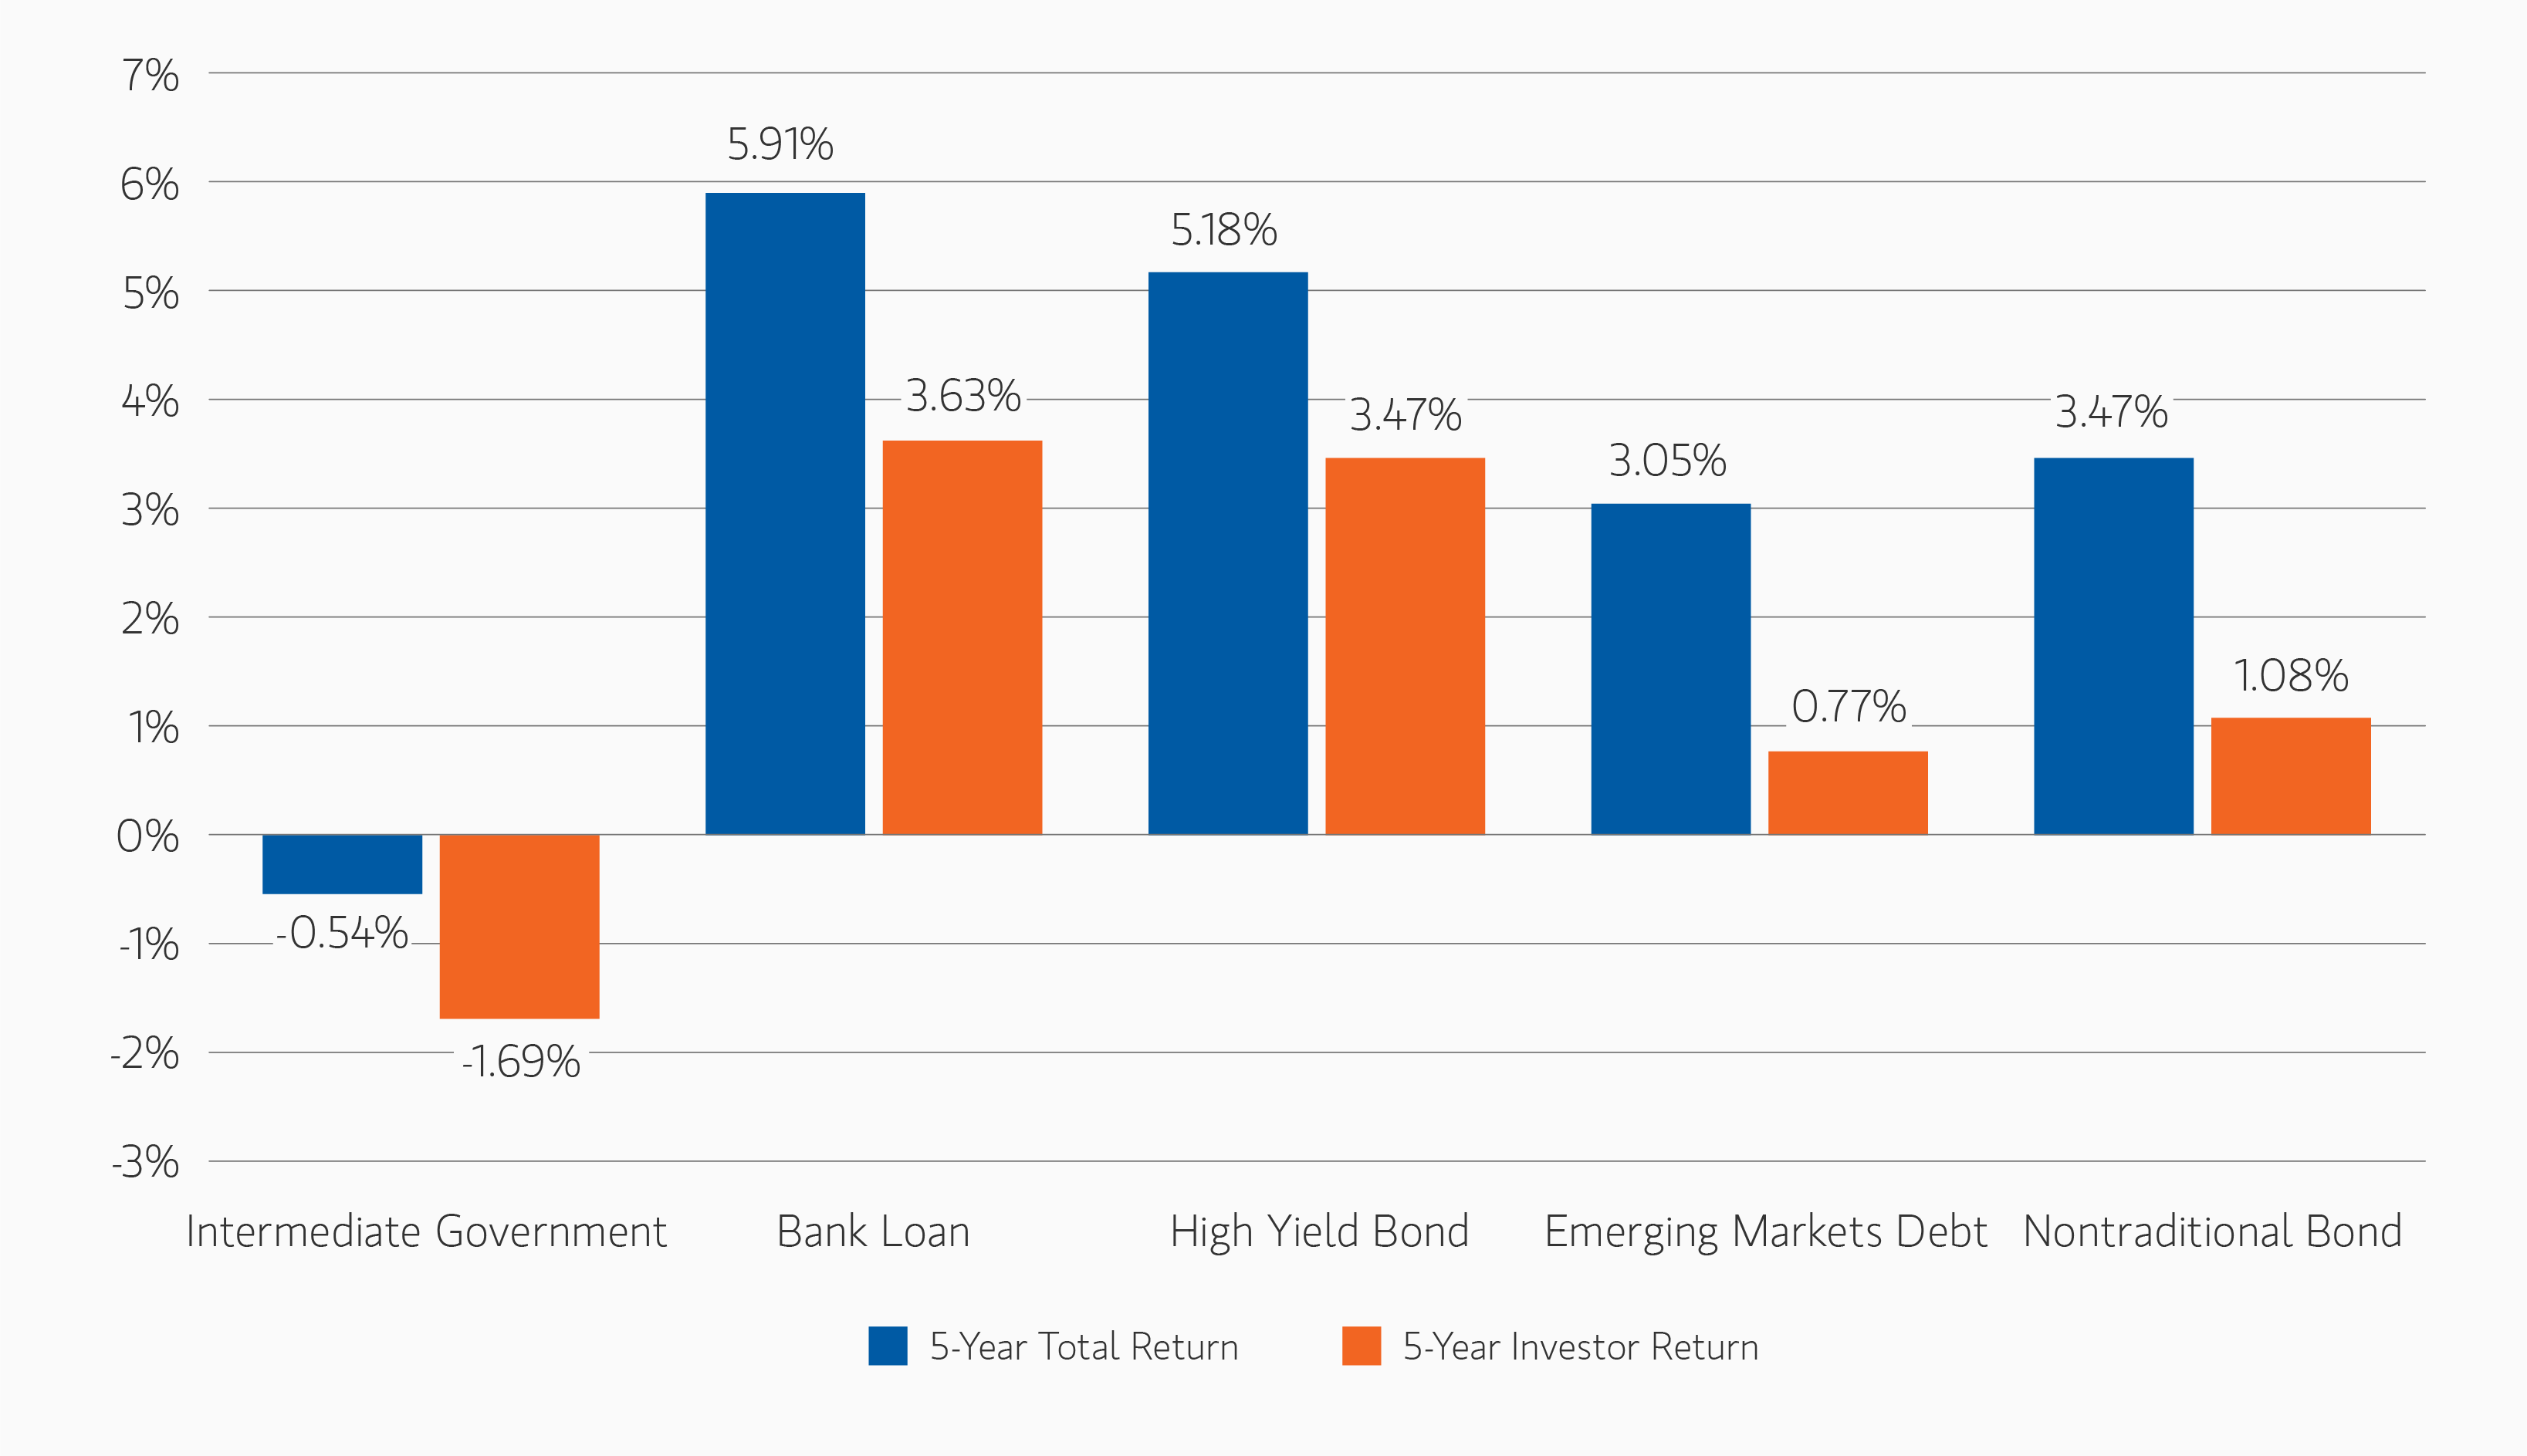
Total Return vs. Investor Return

insight_invest-in-fixed-income-sectors_display2.png

Source: Morningstar. As of 09/30/25. Past performance is no guarantee of future results.2

Top-down and bottom-up
Knowing when and how much to allocate to various fixed income sectors can be extremely important to achieving the best potential total returns. Equally important is the ability to identify attractive opportunities within each sector. For example, there are over 100 different EM countries with investable assets, representing a more than $15 trillion opportunity set3, and each has a unique political, fiscal and monetary policy path, as can be seen in the performance difference across various countries in the EM index. We believe that having a well-resourced, experienced team to identify country-specific alpha opportunities can add a substantial amount of value versus a passive approach.

The same discernment and resources should guide investing in other sectors, such as high yield corporates and mortgage-backed securities (MBS). Take agency MBS, for example. While performance on the Bloomberg U.S. Mortgage Backed Securities Index posted a 1.2% gain last year, examining performance across the MBS coupon stack exposes a wide performance dispersion. Returns spanned a nearly 630 basis point (bps) range, with higher coupon bonds generating strong positive total returns while the lowest coupon bonds underperformed. These cases clearly demonstrate how adding value from bottom-up security selection may augment the flexibility of allocating across sectors, creating a powerful combination.

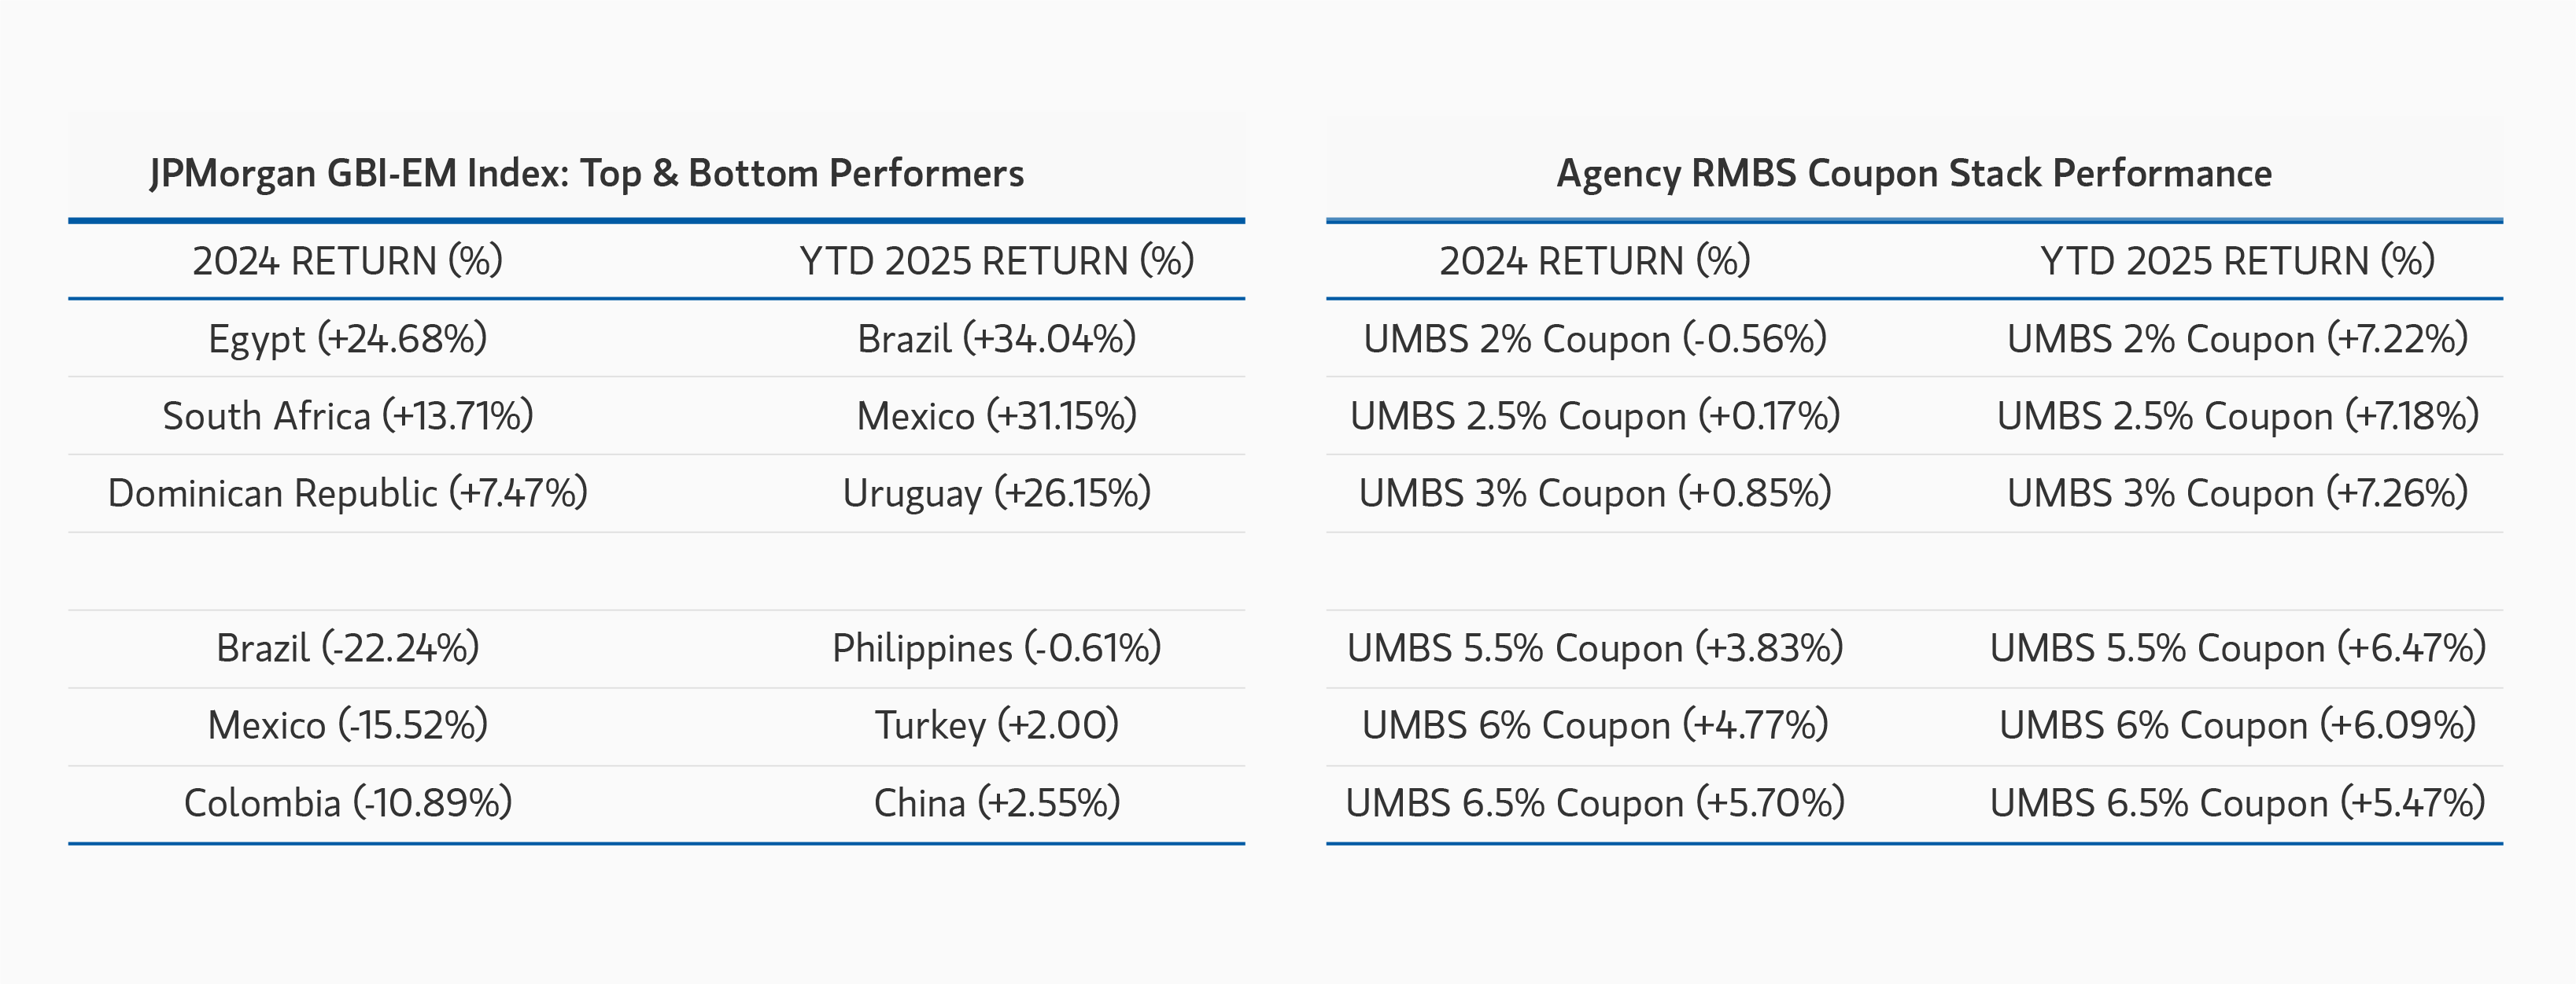
Performance by Asset Class: EM vs. RMBS

insight_invest-in-fixed-income-sectors_display3.png

Source: JPMorgan and Bloomberg. 09/30/25. Past performance is no guarantee of future results.

Bottom Line: A flexible, diversified portfolio of “plus sector” fixed income exposures may benefit investors by actively adding value via both macro-driven, top-down, sector allocation and bottom-up, fundamental security selection.


1 Diversification does not eliminate the risk of loss.
2 5-Year Total Return: Expressed in percentage terms, Morningstar's calculation of total return is determined each month by taking the change in monthly net asset value, reinvesting all income and capital-gains distributions during that month, and dividing by the starting NAV. Reinvestments are made using the actual reinvestment NAV, and daily payoffs are reinvested monthly. 5-Year Investor Return: Morningstar® Investor Return™ (also known as dollar-weighted return) measures how the average investor fared in a fund over a period of time. Investor return incorporates the impact of cash inflows and outflows from purchases and sales and the growth in fund assets. In contrast to total returns, investor returns account for all cash flows into and out of the fund to measure how the average investor performed over time. Investor return is calculated in a similar manner to internal rate of return. Investor return measures the compound growth rate in the value of all dollars invested in the fund over the evaluation period. Investor return is the growth rate that will link the beginning total net assets plus all intermediate cash flows to the ending total net assets.
3 Source: Eaton Vance, JPMorgan. As of 03/31/2025

The Author

DEFINITIONS:

Commercial Mortgage-Backed Securities (CMBS) are subject to credit risk and prepayment risk. Although prepayment risk is present, it is of a lesser degree in CMBS than in the residential mortgage market; commercial real estate property loans often contain provisions which substantially reduce the likelihood that such securities will be prepaid.

A corporate bond is a debt security issued by a corporation backed by the payment ability of the company, which is typically money to be earned from future operations. In some cases, the company's physical assets may be used as collateral for bonds. Corporate bonds are considered higher risk than government bonds and hence interest rates are generally higher.

Duration is a measure of the sensitivity of the price (the value of principal) of a fixed income investment to a change in interest rates. Duration is expressed as a number of years. Rising interest rates mean falling bond prices, while declining interest rates mean rising bond prices.

High Yield. Securities are classified as high yield if the middle rating of Moody's, Fitch, and S&P is Ba1/BB+/BB+ or below.

Investment Grade. Bonds rated BBB-/Baa3, or better, by S&P or Moody’s, respectively.

Mortgage- and asset-backed securities are sensitive to early prepayment risk and a higher risk of default and may be hard to value and difficult to sell (liquidity risk). They are also subject to credit, market and interest rate risks.

Spread Duration is a measurement of the spread of a fixed-income security rate and the risk-free rate of return.

Yield to Worst is the lowest potential yield that can be received on a bond without the issuer actually defaulting. The yield to worst is calculated by making worst-case scenario assumptions on the issue by calculating the returns that would be received if provisions, including prepayment, call or sinking fund, are used by the issuer.

RMBS. Residential mortgage-backed securities (RMBS) are debt instruments backed by pools of residential loans, including mortgages and home-equity loans.

Net Asset Value (NAV) is the dollar value of a single mutual fund share, based on the value of the underlying assets of the fund minus its liabilities, divided by the number of shares outstanding. It is calculated at the end of each business day.

INDEX DEFINITIONS
The Bloomberg Aggregate Bond Index is an index comprised of approximately 6,000 publicly traded bonds including United States government, mortgage-backed, corporate and Yankee bonds with an average maturity of approximately 10 years.

The ICE BofA US Treasury Index is a benchmark that tracks the performance of U.S. dollar-denominated sovereign debt issued by the U.S. government. These are U.S. Treasury securities that have at least one year remaining to maturity, a fixed coupon, and a minimum of $1 billion outstanding. This index serves as a key indicator for the overall performance of the U.S. Treasury market. IG Corporates: ICE BofA US Corporate Index.

Bloomberg U.S. Mortgage-Backed Securities (MBS) Index measures agency mortgage-backed pass-through securities issued by GNMA.

The J.P. Morgan Non-Agency RMBS Credit Index is a benchmark that tracks the performance of U.S. dollar-denominated non-agency residential mortgage-backed securities (RMBS). CMBS: ICE BofA US Fixed Rate CMBS Index

The ICE BofA US Fixed Rate ABS Index tracks the performance of investment-grade, fixed-rate, asset-backed securities (ABS) that are denominated in U.S. dollars and issued in the U.S. domestic market. This index is a benchmark for the performance of this specific segment of the structured finance market. High Yield: ICE BofA US High Yield Index

The JPMorgan EMBI Global Diversified Index is an unmanaged, market-capitalization weighted, total-return index tracking the traded market for U.S.-dollar-denominated Brady bonds, Eurobonds, traded loans, and local market debt instruments issued by sovereign and quasi-sovereign entities. Local EMD: JPMorgan GBI-EM Global Diversified Index

Net Asset Value (NAV) is the dollar value of a single mutual fund share, based on the value of the underlying assets of the fund minus its liabilities, divided by the number of shares outstanding. It is calculated at the end of each business day.

Basis point (bp): One basis point = 0.01%.

Risk considerations: The views and opinions and/or analysis expressed are those of the author or the investment team as of the date of preparation of this material and are subject to change at any time without notice due to market or economic conditions and may not necessarily come to pass.

This material has been prepared on the basis of publicly available information, internally developed data and other third-party sources believed to be reliable. However, no assurances are provided regarding the reliability of such information and the Firm has not sought to independently verify information taken from public and third-party sources.

This material is a general communication, which is not impartial and all information provided has been prepared solely for informational and educational purposes and does not constitute an offer or a recommendation to buy or sell any particular security or to adopt any specific investment strategy. The information herein has not been based on a consideration of any individual investor circumstances and is not investment advice, nor should it be construed in any way as tax, accounting, legal or regulatory advice. To that end, investors should seek independent legal and financial advice, including advice as to tax consequences, before making any investment decision.

The indexes do not include any expenses, fees or sales charges. It is not possible to invest directly in an index. Any index referred to herein is the intellectual property (including registered trademarks) of the applicable licensor. Any product based on an index is in no way sponsored, endorsed, sold or promoted by the applicable licensor and it shall not have any liability with respect thereto.

The Firm has not authorised financial intermediaries to use and to distribute this material, unless such use and distribution is made in accordance with applicable law and regulation. Additionally, financial intermediaries are required to satisfy themselves that the information in this material is appropriate for any person to whom they provide this material in view of that person’s circumstances and purpose. The Firm shall not be liable for, and accepts no liability for, the use or misuse of this material by any such financial intermediary.

This material may be translated into other languages. Where such a translation is made this English version remains definitive. If there are any discrepancies between the English version and any version of this material in another language, the English version shall prevail.

The whole or any part of this material may not be directly or indirectly reproduced, copied, modified, used to create a derivative work, performed, displayed, published, posted, licensed, framed, distributed or transmitted or any of its contents disclosed to third parties without the Firm’s express written consent. This material may not be linked to unless such hyperlink is for personal and non-commercial use. All information contained herein is proprietary and is protected under copyright and other applicable law.

Morgan Stanley Investment Management Inc. is the adviser to the Eaton Vance ETFs. Eaton Vance ETFs are distributed by Foreside Fund Services, LLC.

Eaton Vance, is part of Morgan Stanley Investment Management, the asset management division of Morgan Stanley.

Before investing in any Eaton Vance ETF, prospective investors should consider carefully the investment objective(s), risks, and charges and expenses. The current prospectus contains this and other information. To obtain a prospectus or summary prospectus (which includes the applicable fund’s current fees and expenses, if different from those in effect as of the date of this material), download a copy at eatonvance.com or call 1-800-548-7786. Prospective investors should read the prospectus carefully before investing

NOT FDIC INSURED. OFFER NO BANK GUARANTEE. MAY LOSE VALUE. NOT INSURED BY ANY FEDERAL GOVERNMENT AGENCY. NOT A DEPOSIT.